A Guide to Big Questions in Macroeconomics
Overview
Part I: Economic Growth
Why are some countries rich and others poor?
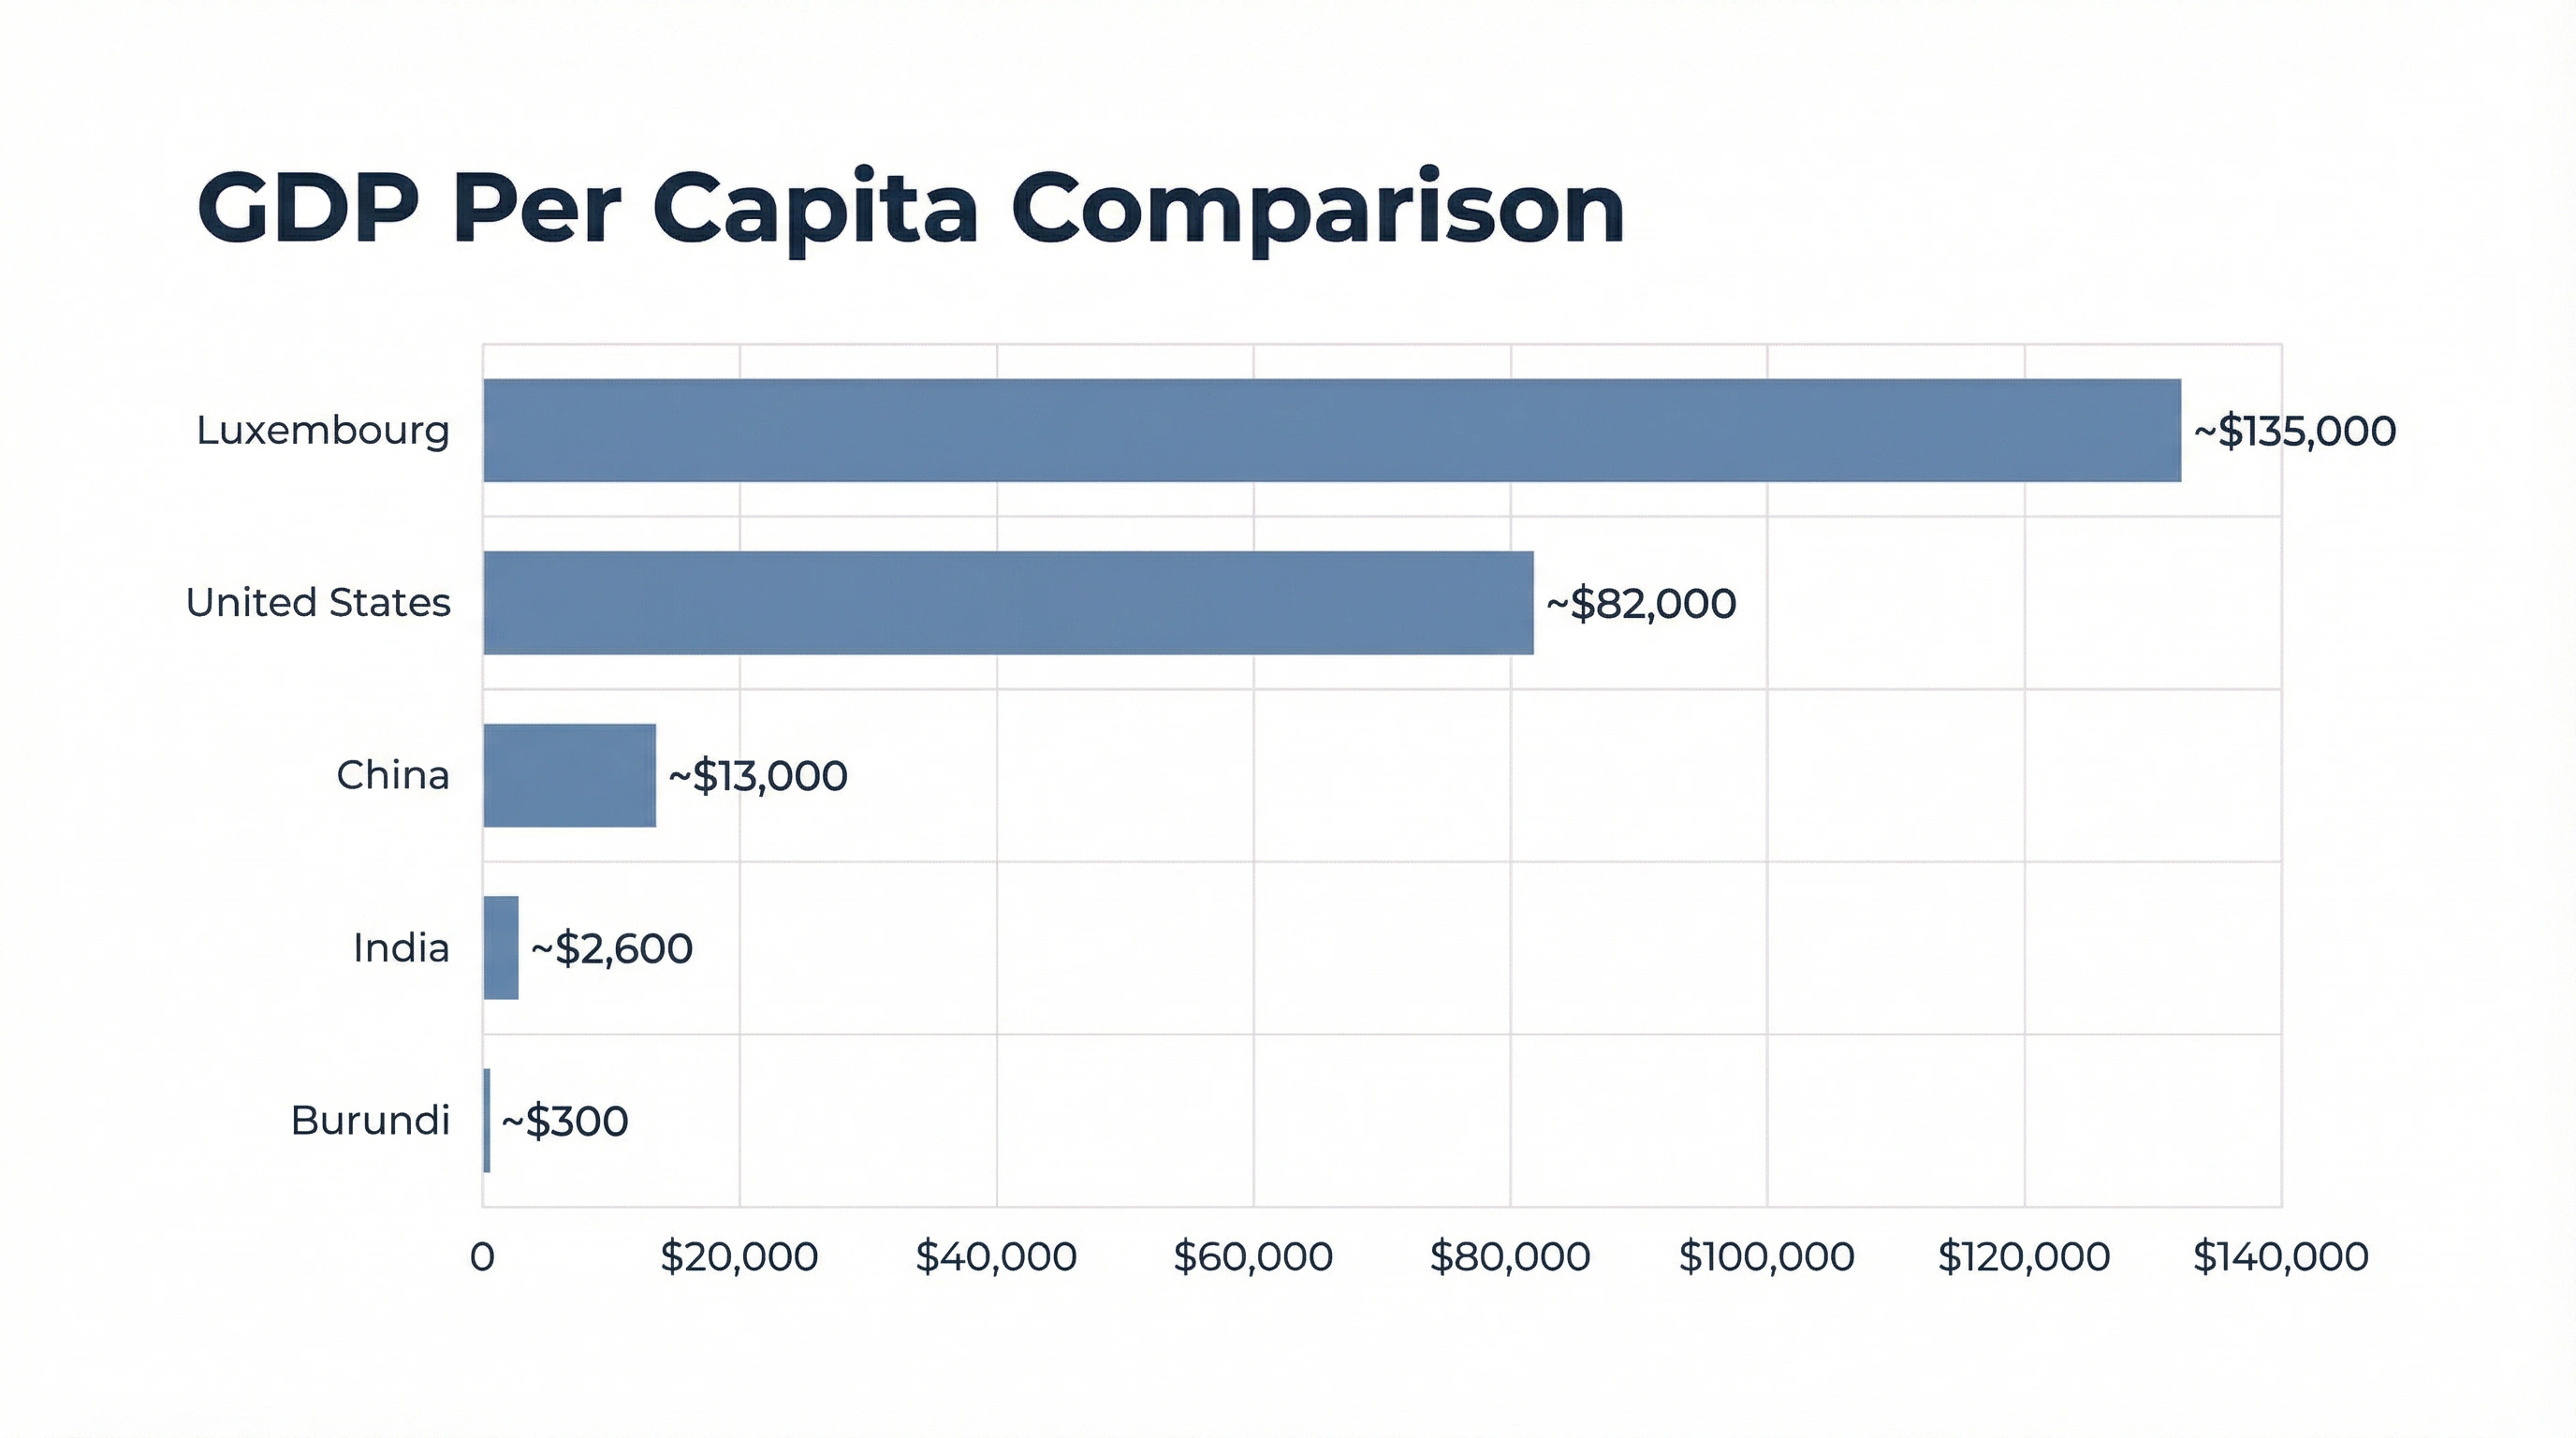
The Income Gaps
GDP Per Capita Comparison
Growth Trajectories
GDP per capita in 1950 and 2016
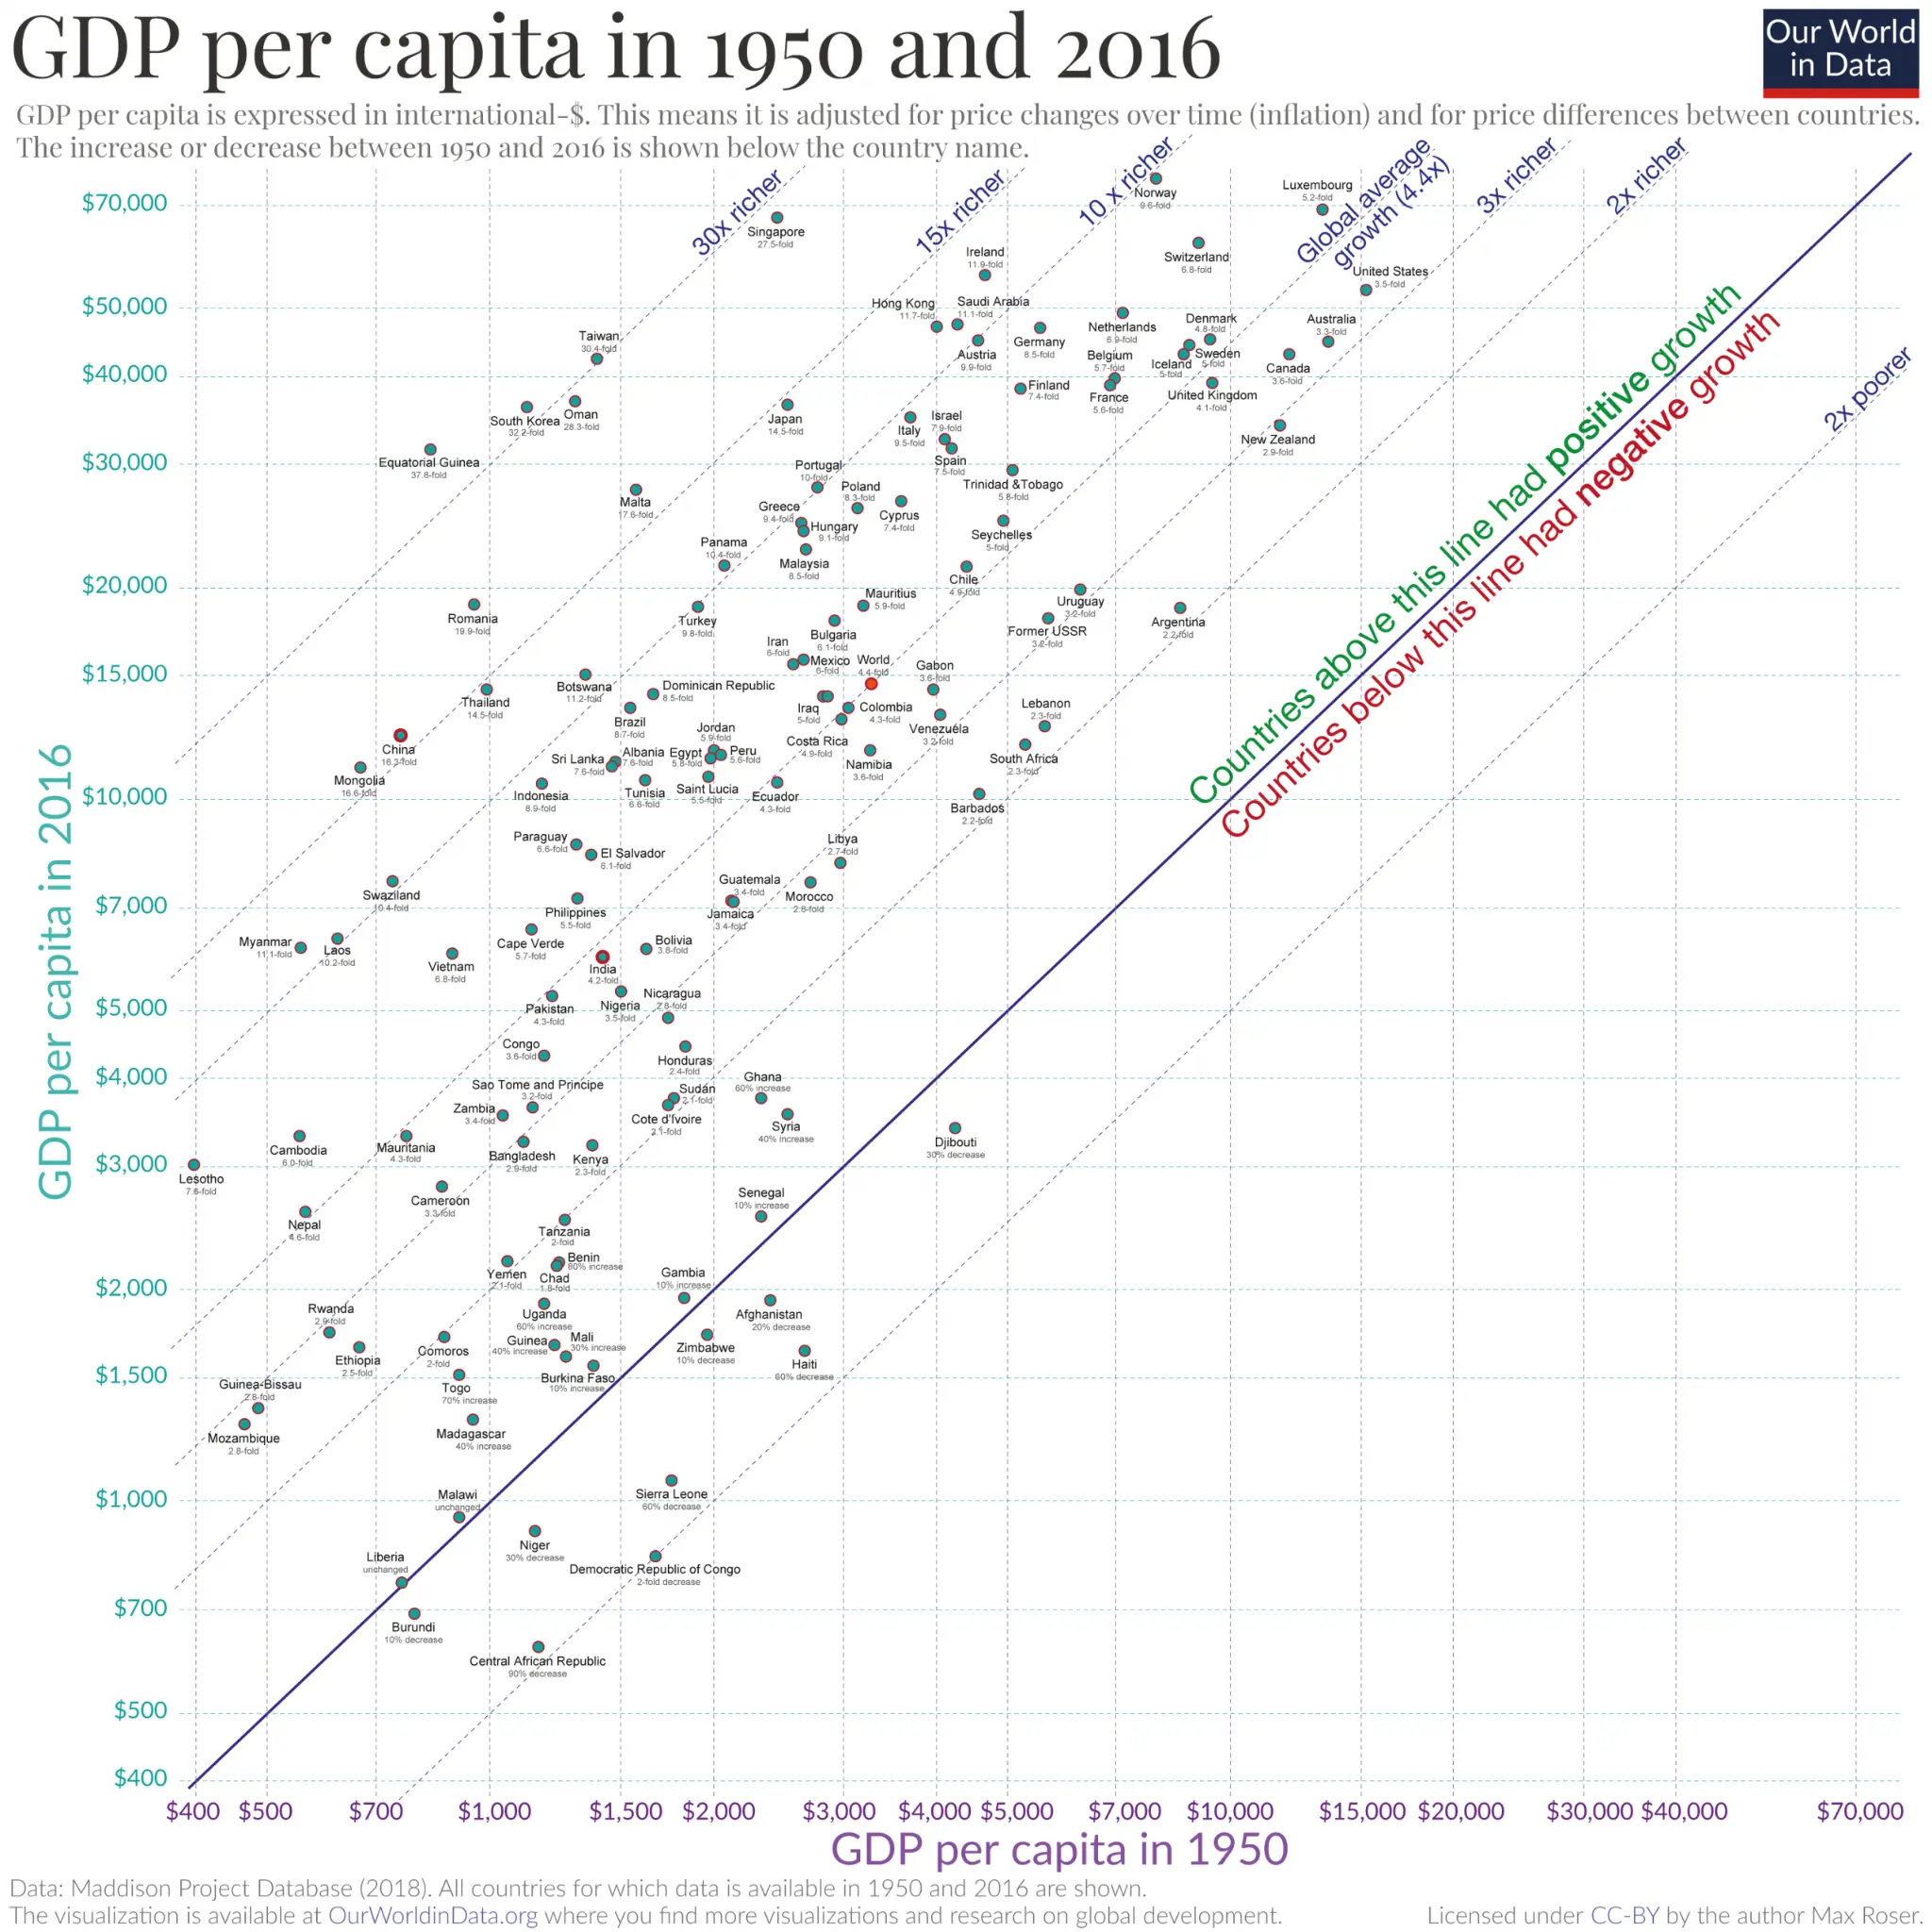
Full Chart
Click to zoom into any area
The Lucas Question
The staggering consequences of growth
"I do not see how one can look at figures like these without seeing them representing possibilities. Is there some action a government of India could take that would lead the Indian economy to grow like Indonesia's or Egypt's? If so, what exactly? If not, what is it about the "nature of India" that makes it so? The consequences for human welfare involved in questions like these are simply staggering: once one starts to think about them, it is hard to think about anything else."
— Robert Lucas (1988)
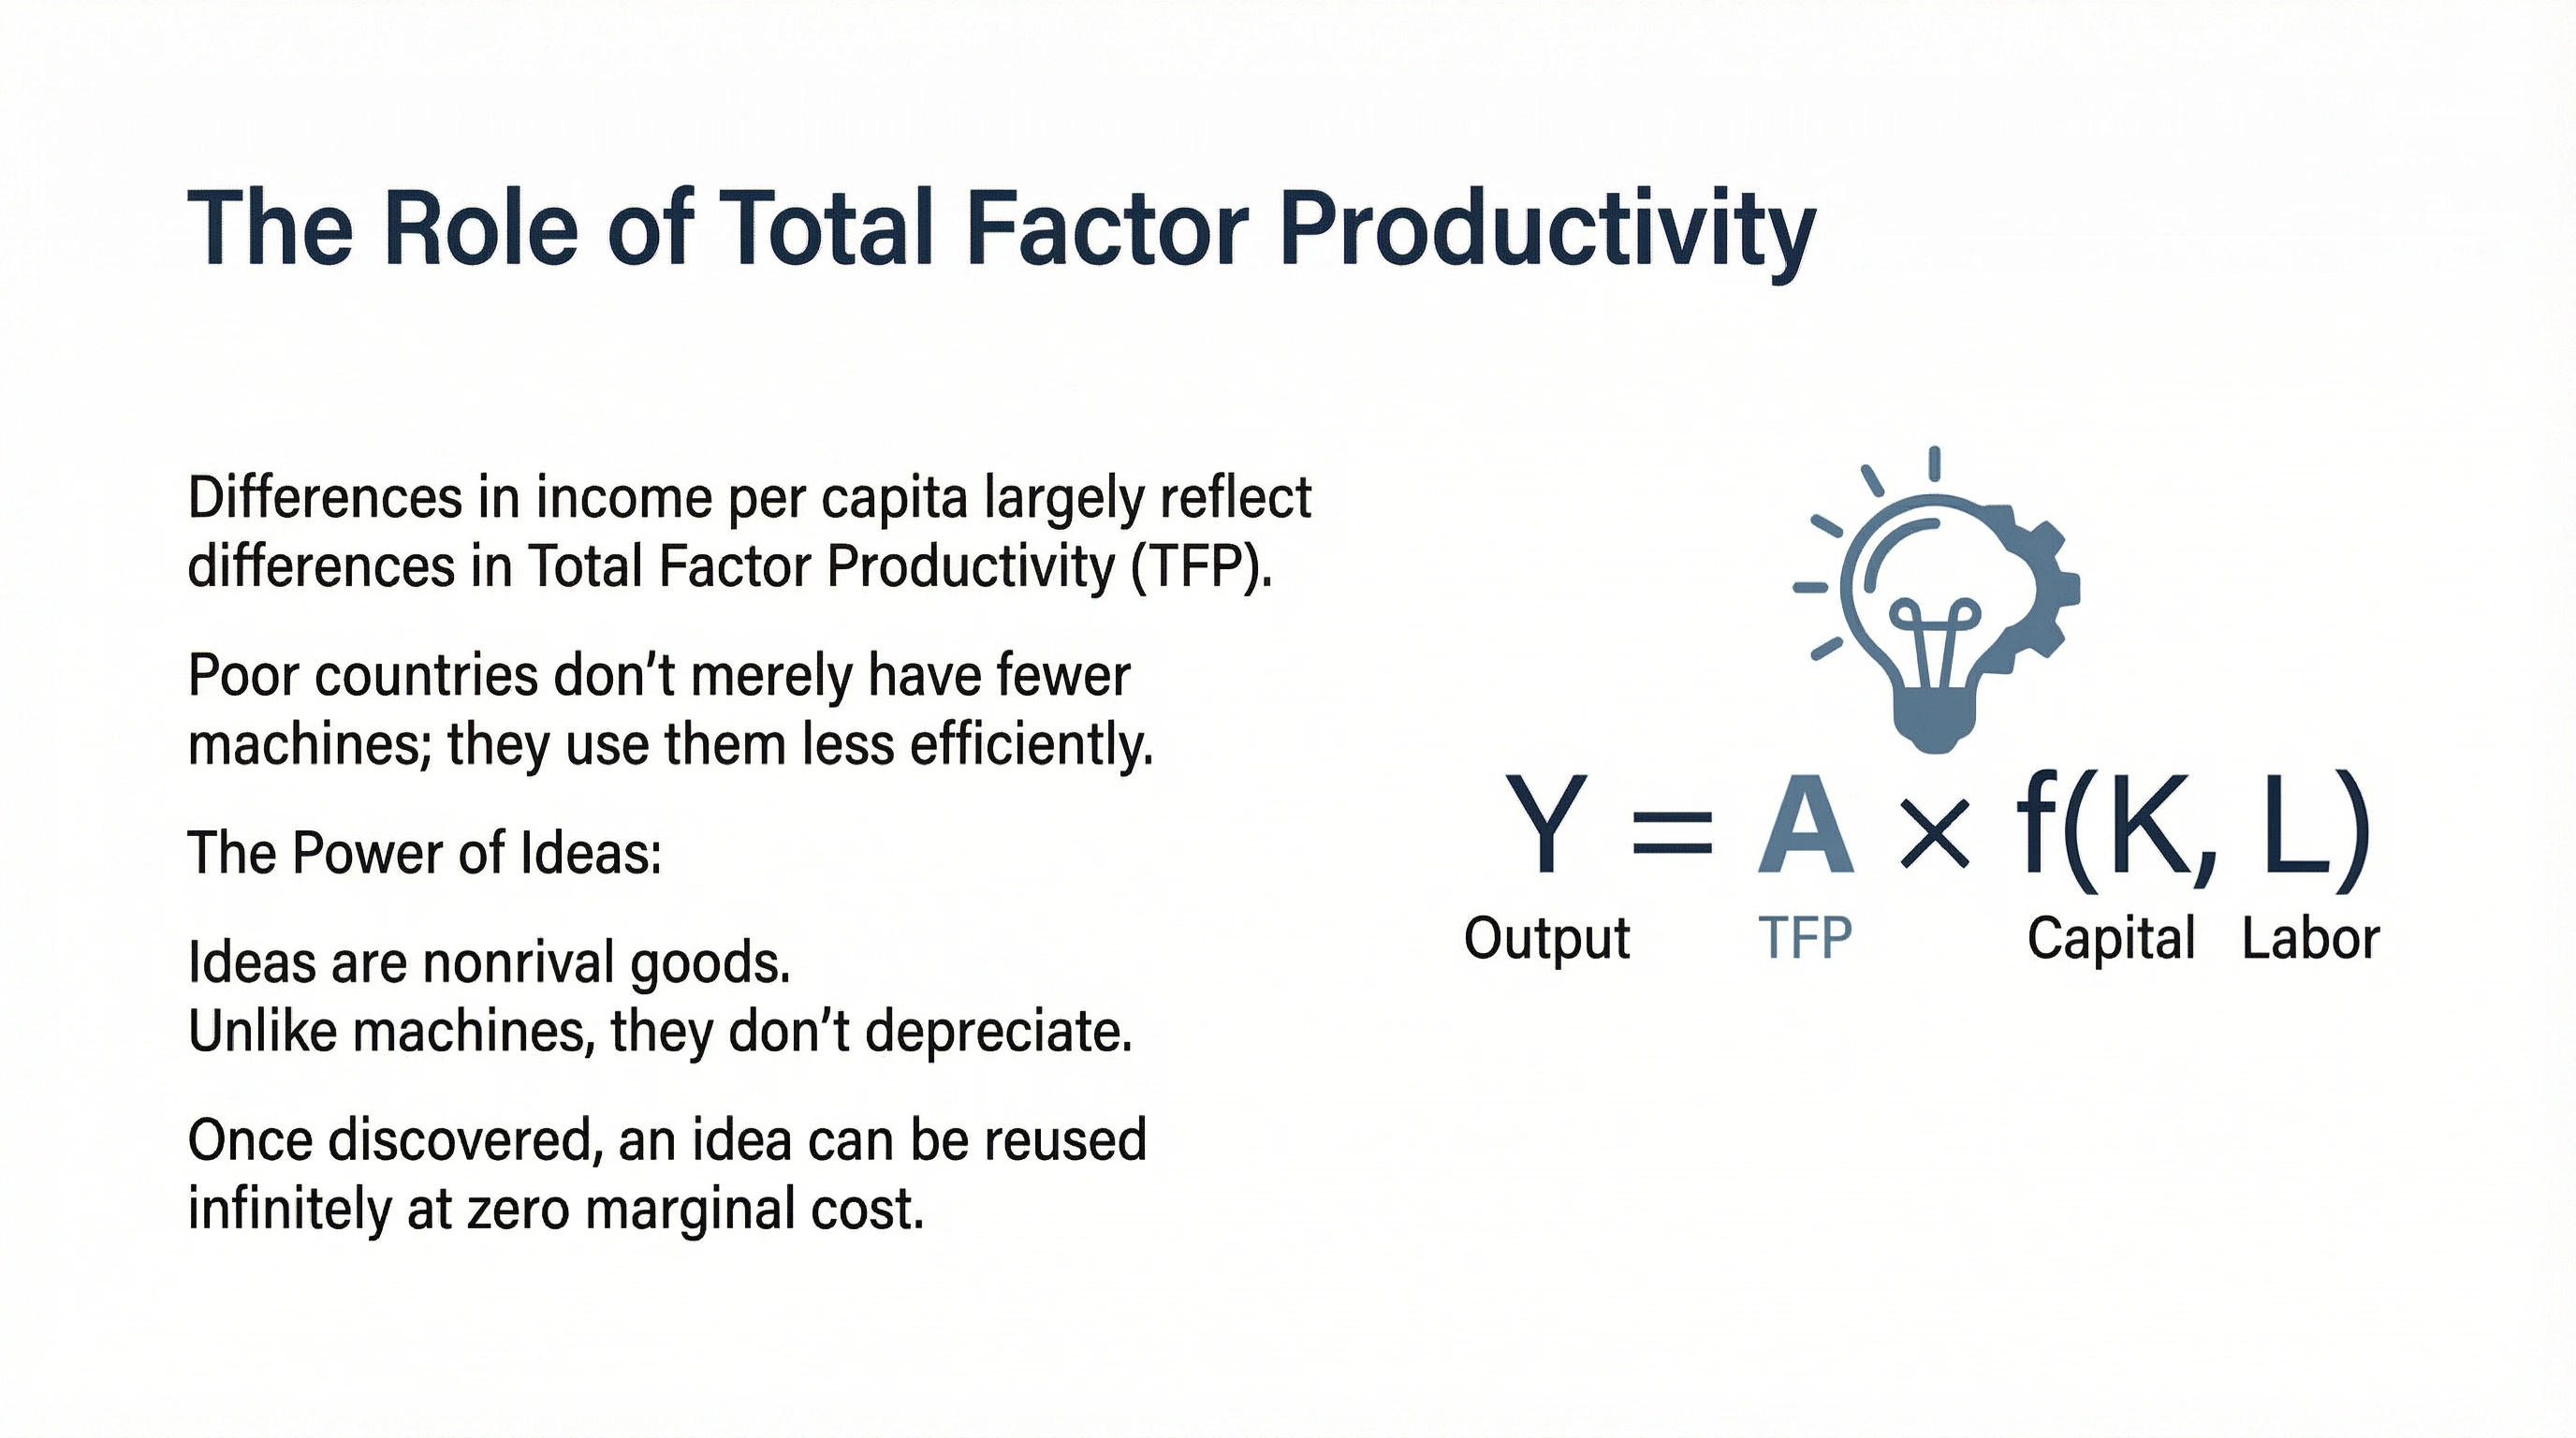
Total Factor Productivity
It's not just capital, it's efficiency
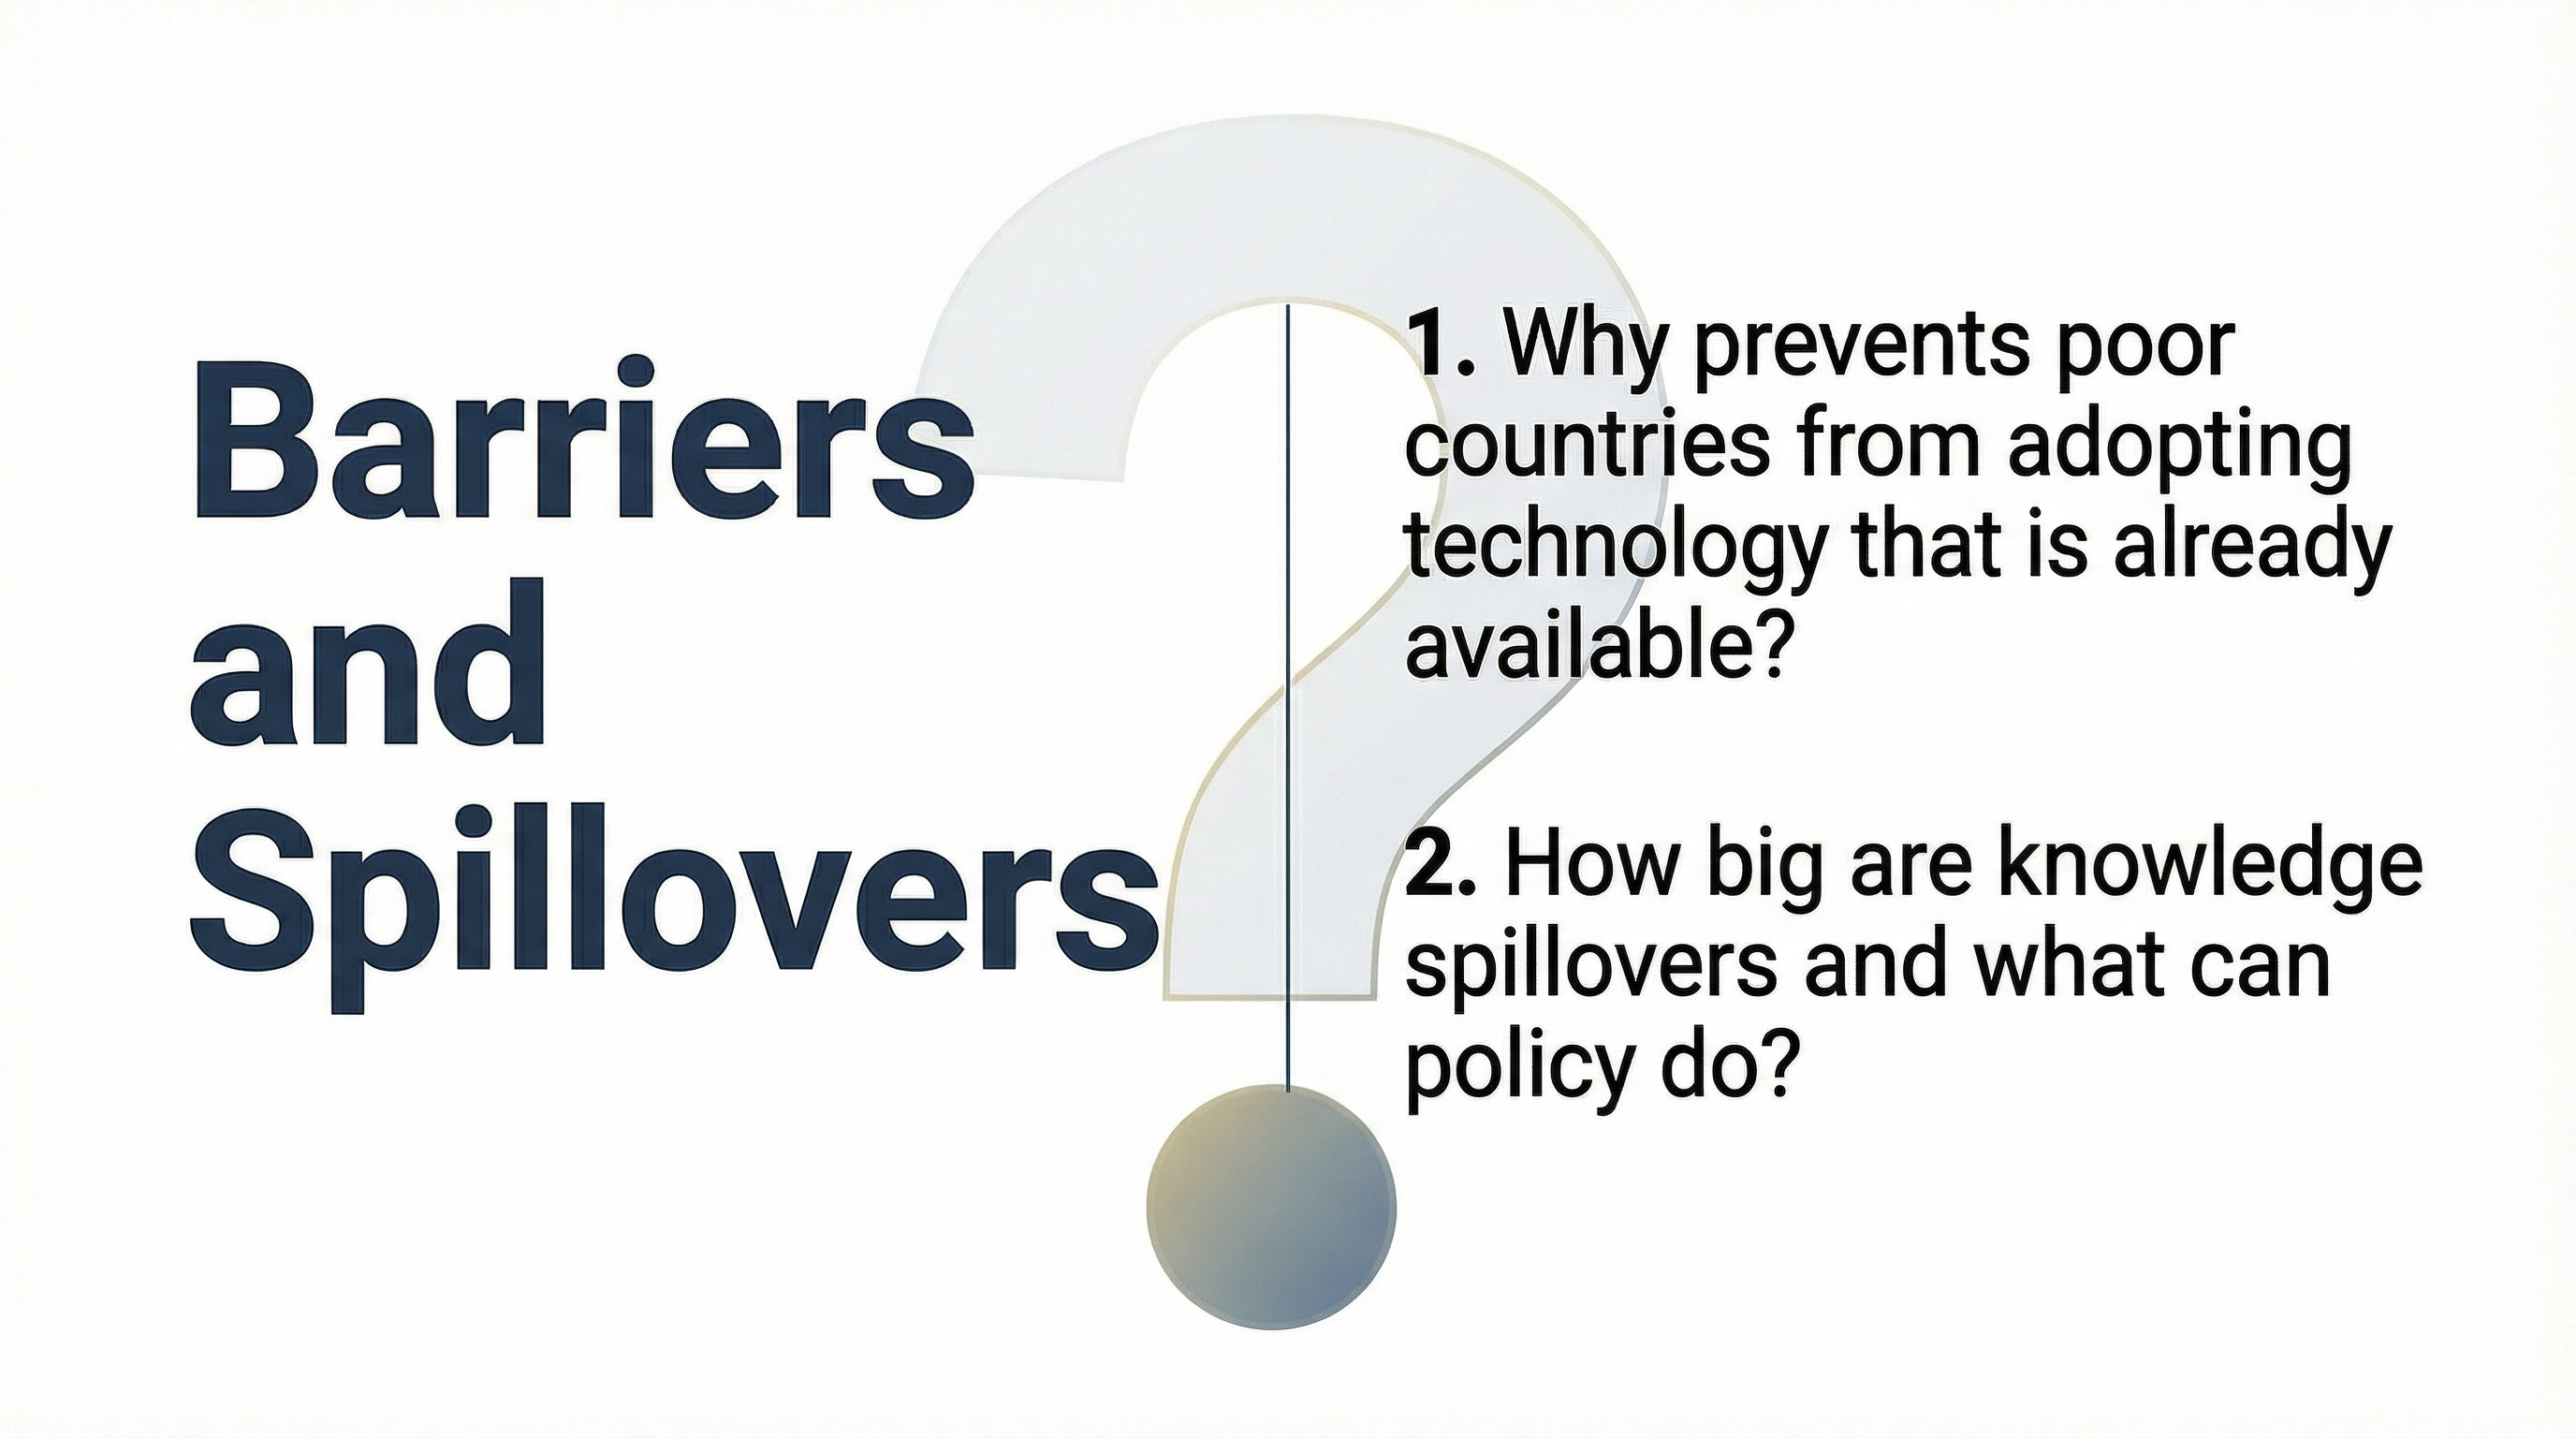
Barriers and Spillovers
Technology adoption and knowledge spillovers
Part II: Business Cycles
Booms, Recessions, and Stabilization
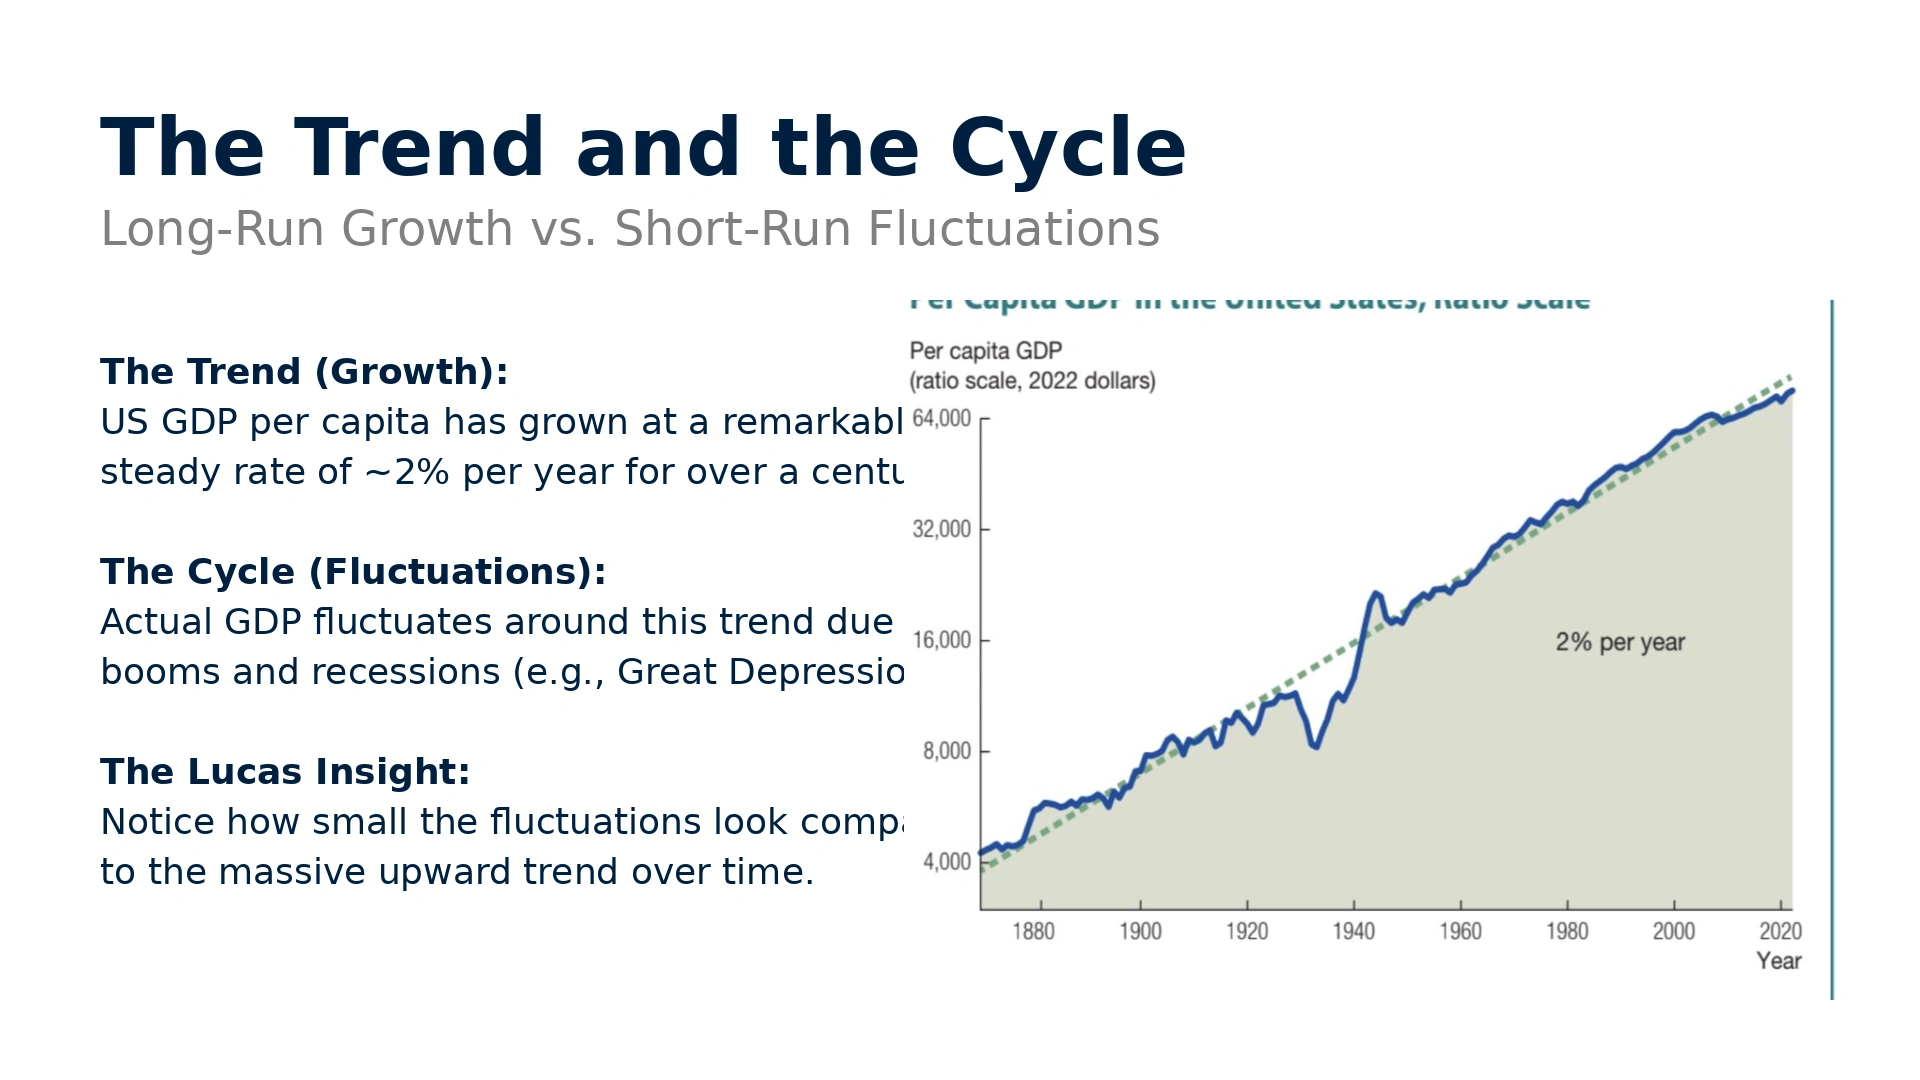
The Trend and the Cycle
Long-Run Growth vs. Short-Run Fluctuations
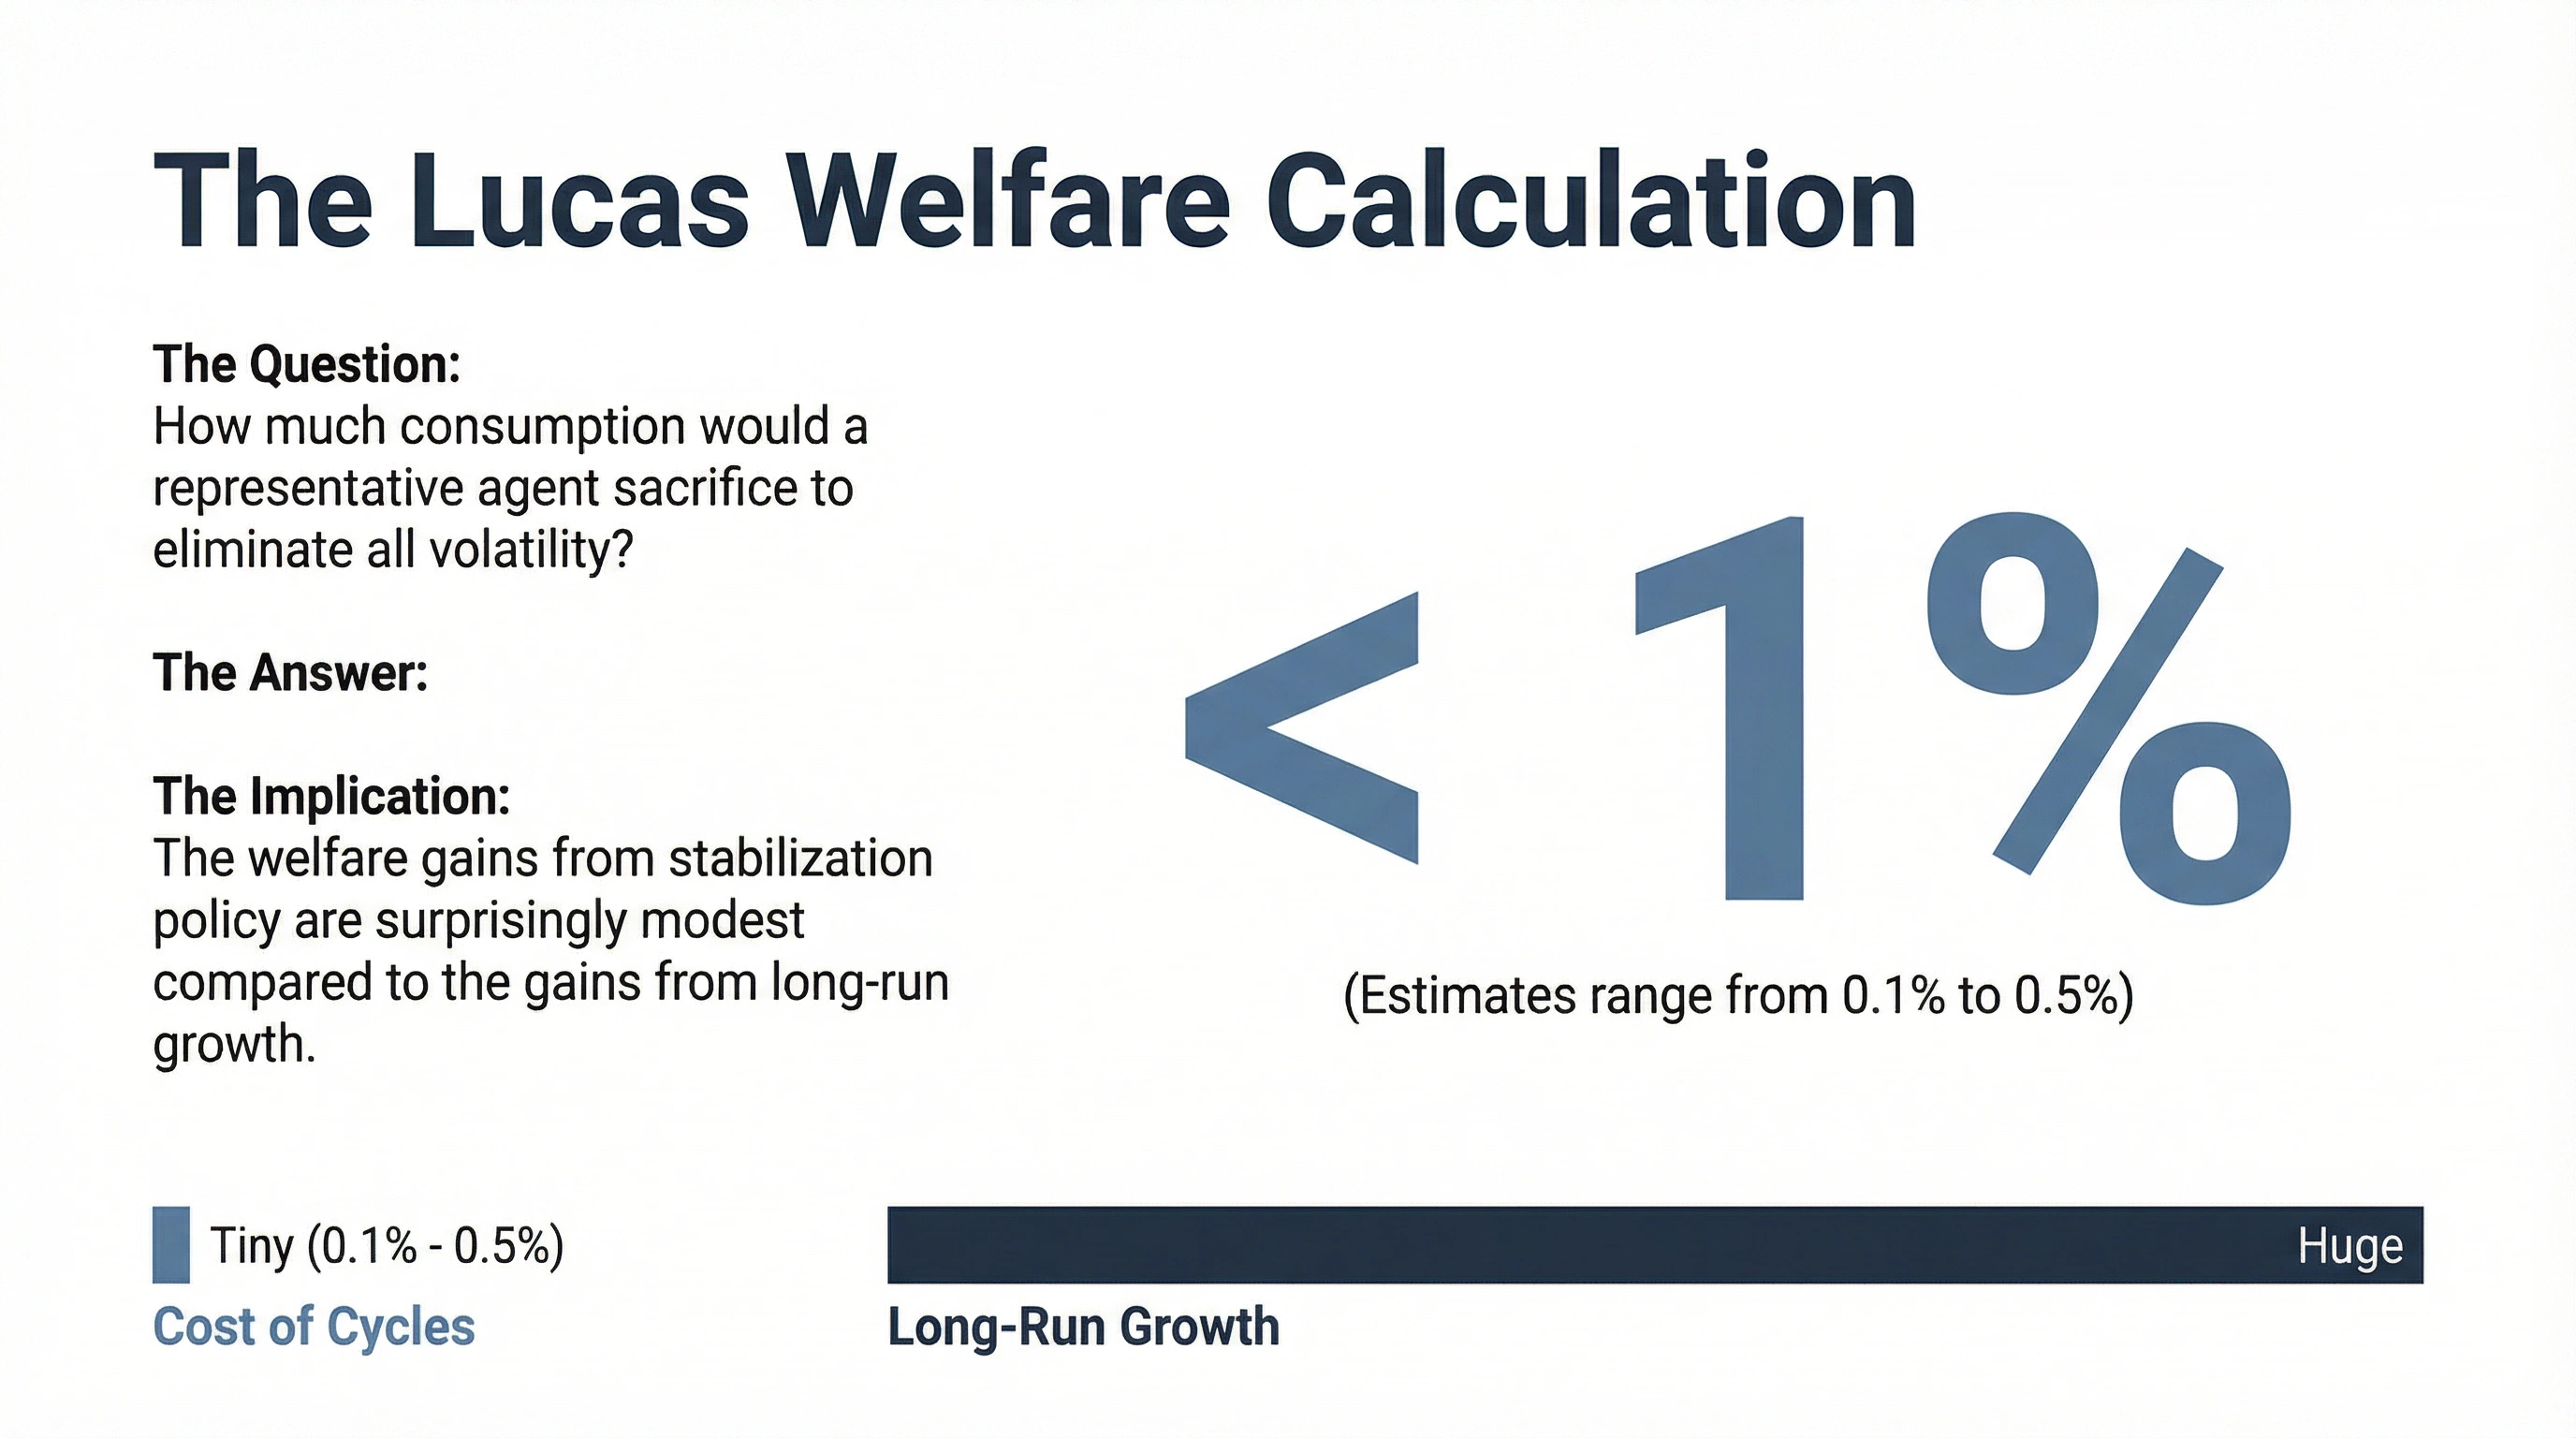
The Cost of Cycles
Surprisingly small compared to growth
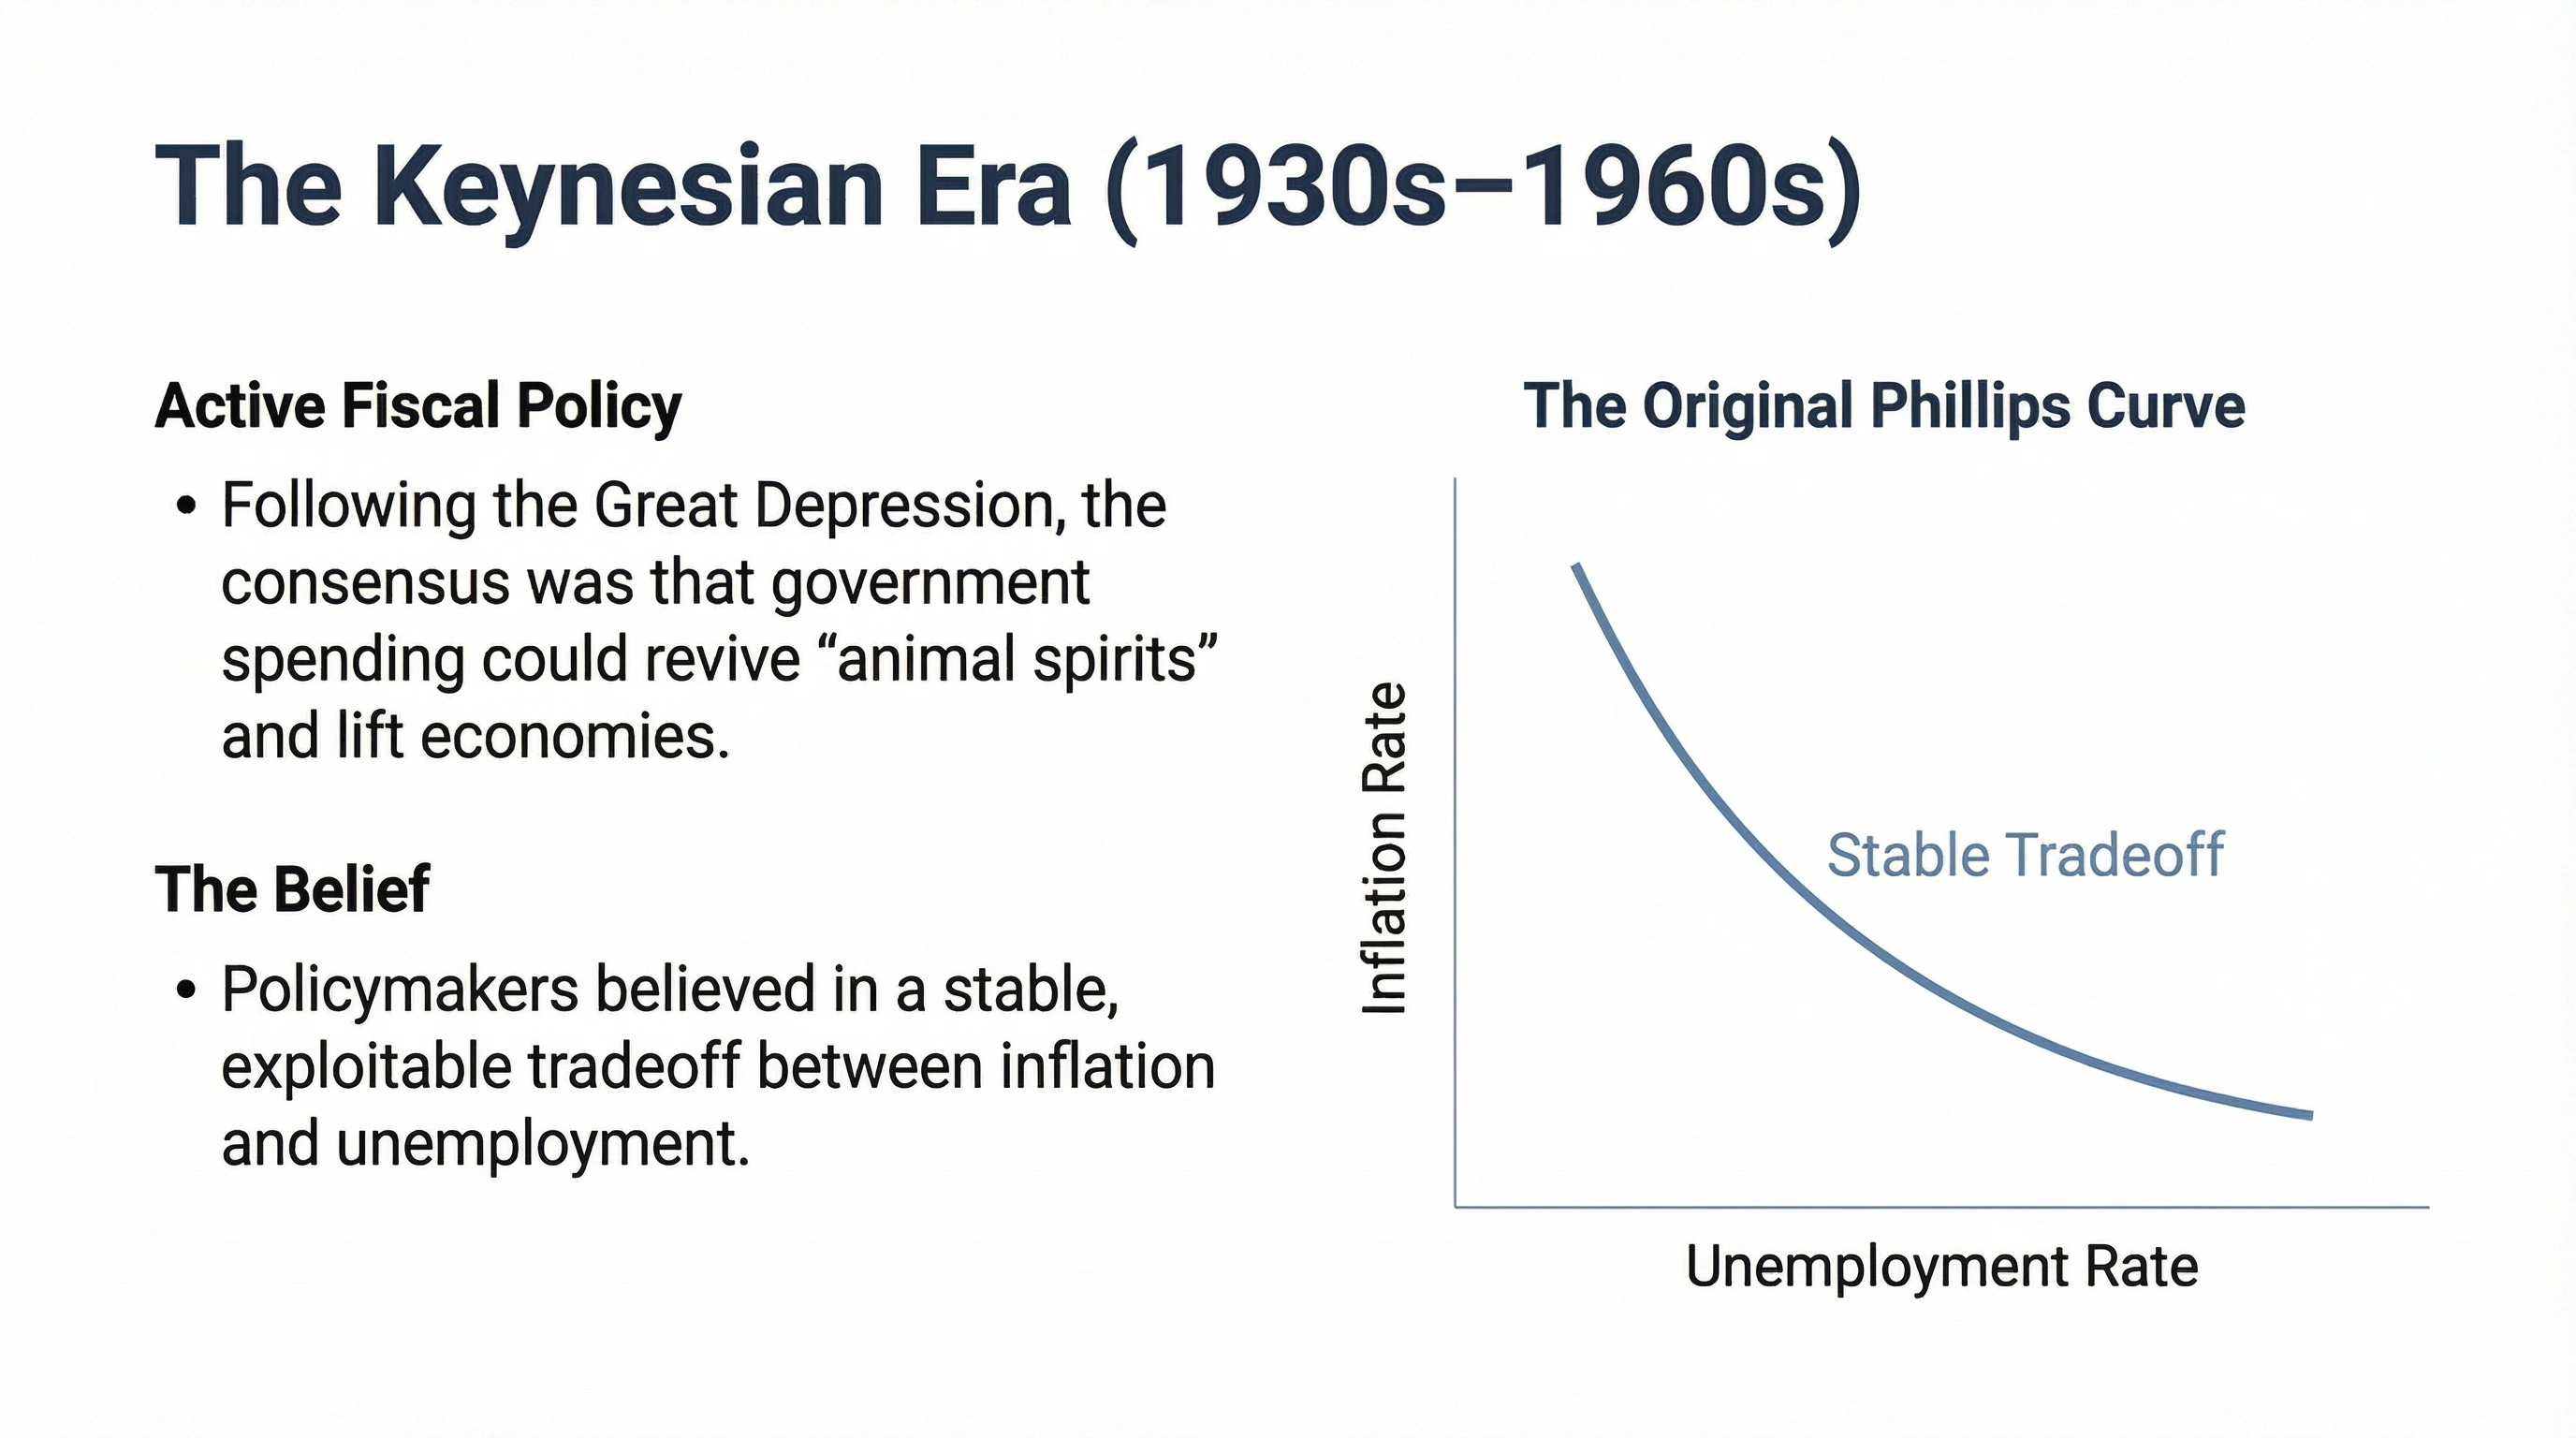
The Keynesian Era
The belief in a stable tradeoff
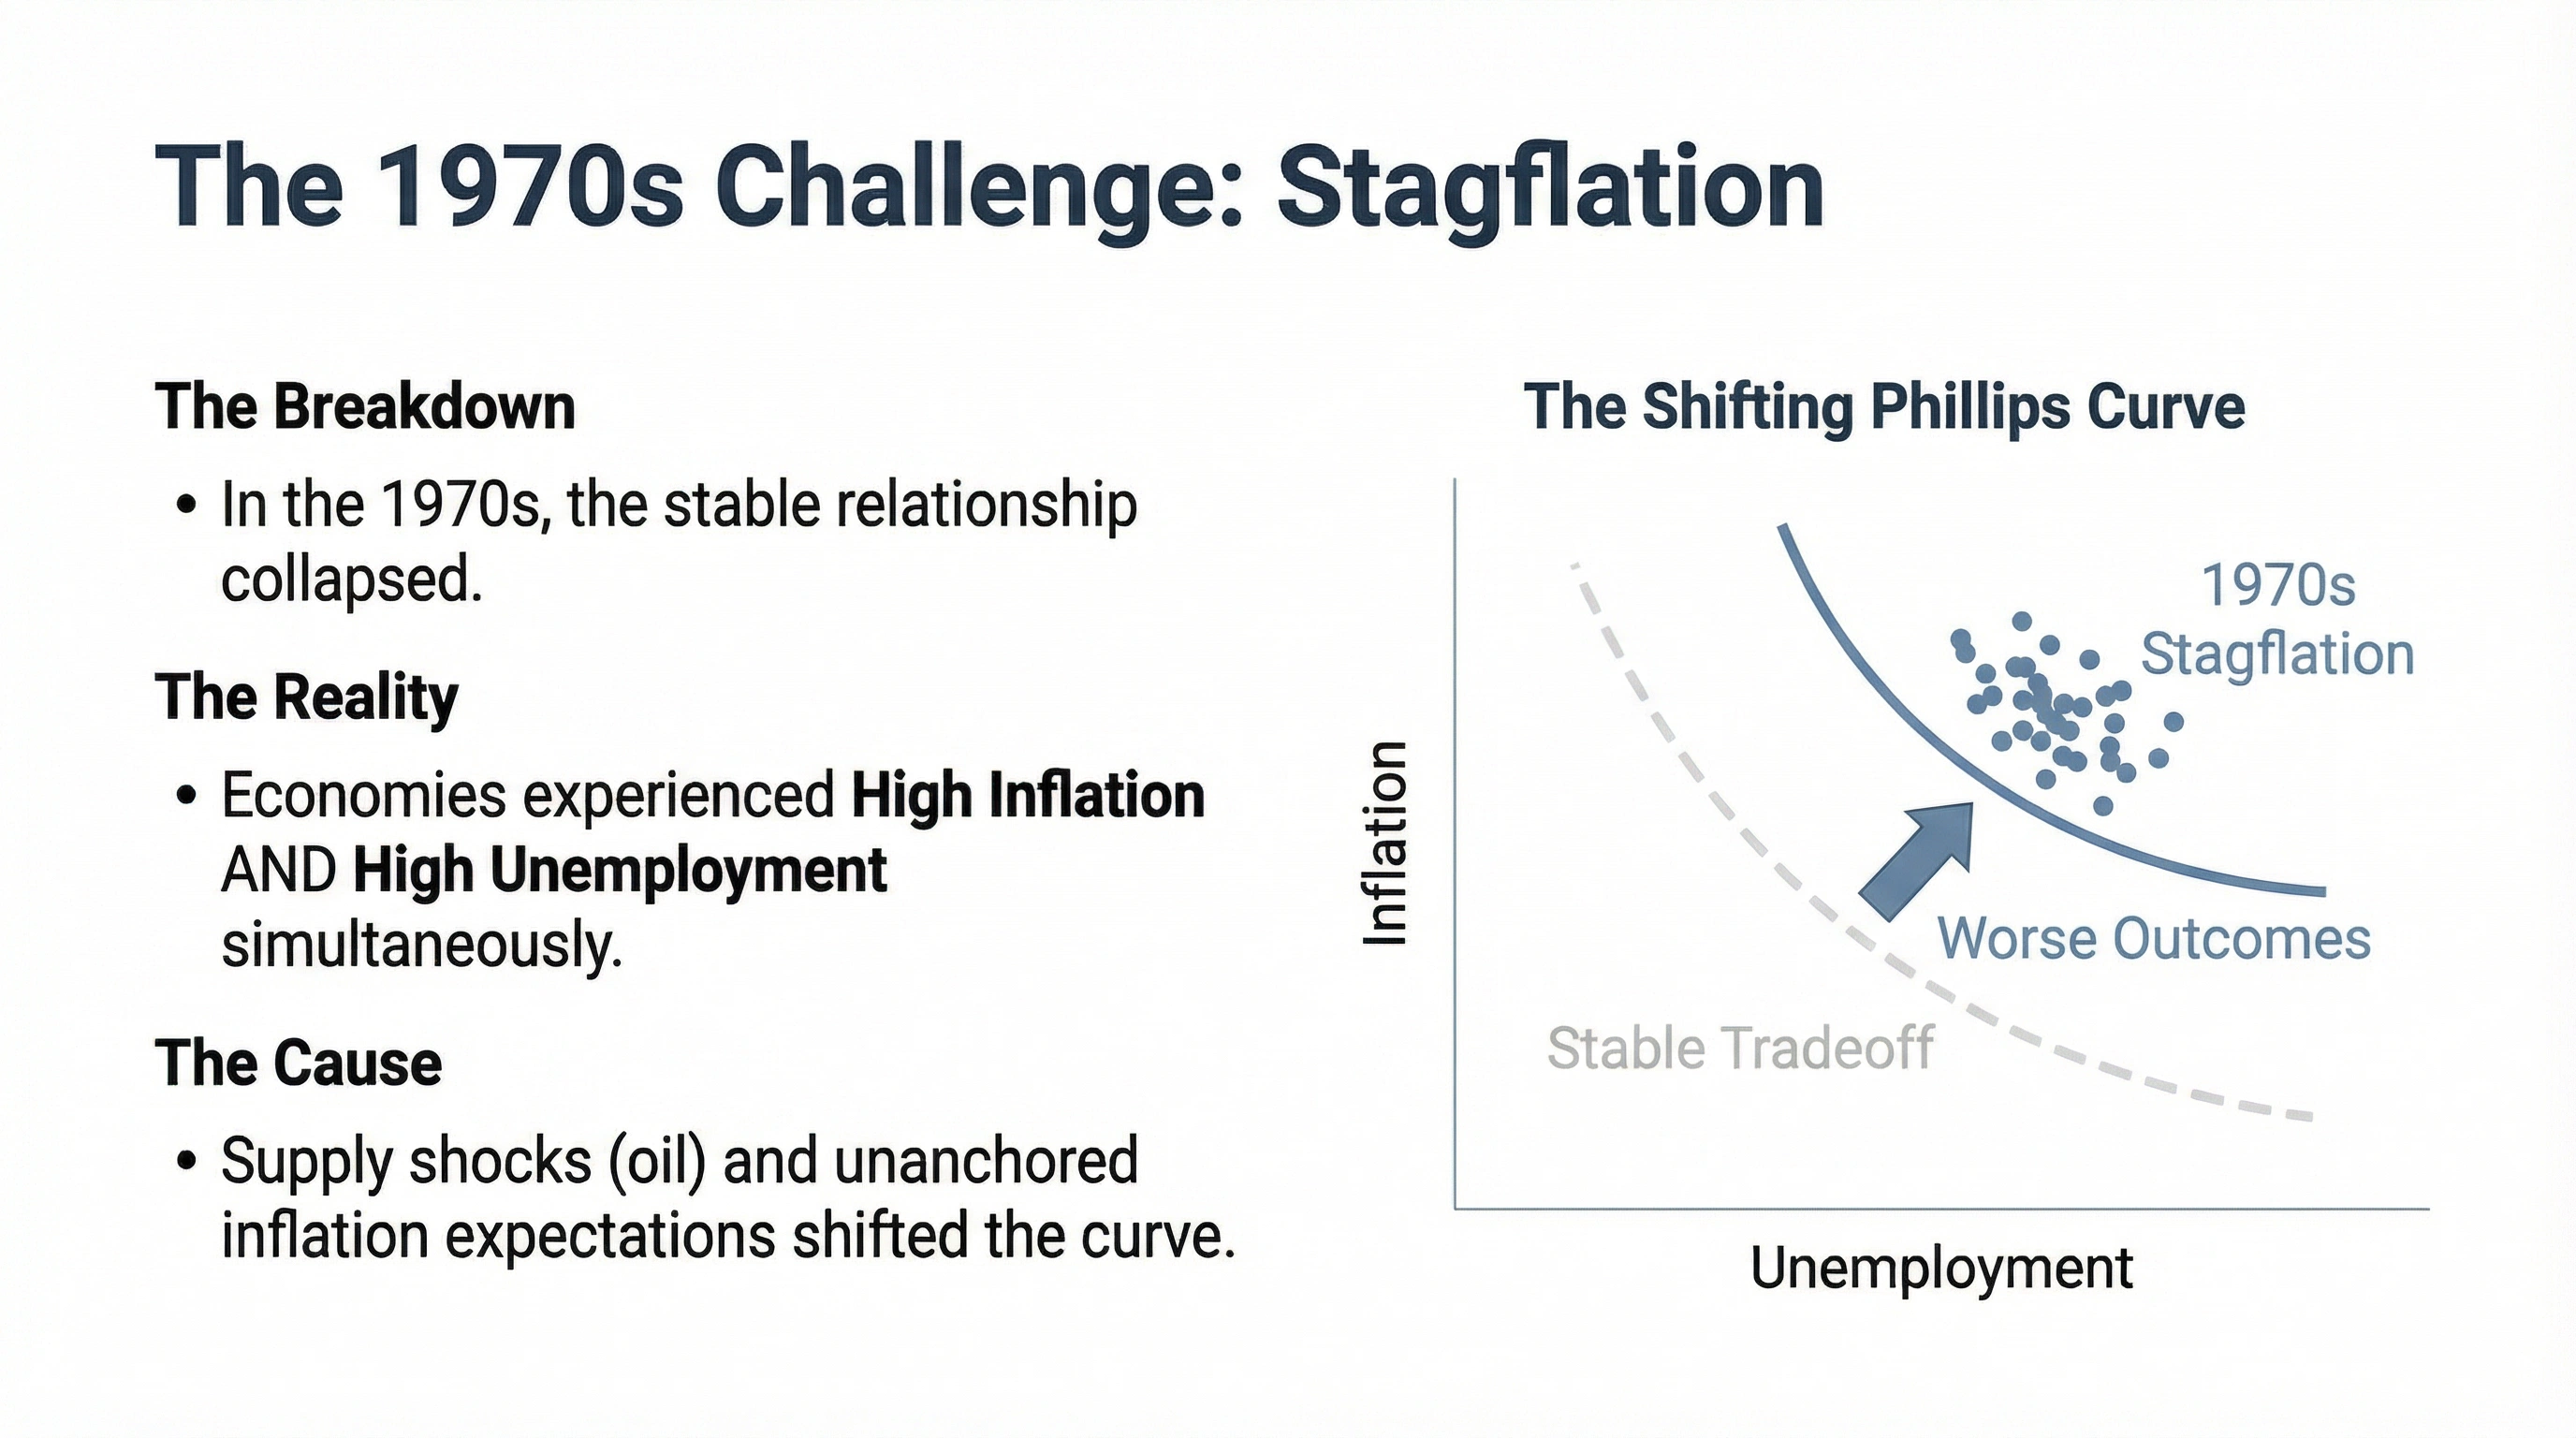
The 1970s Challenge
When the tradeoff collapsed
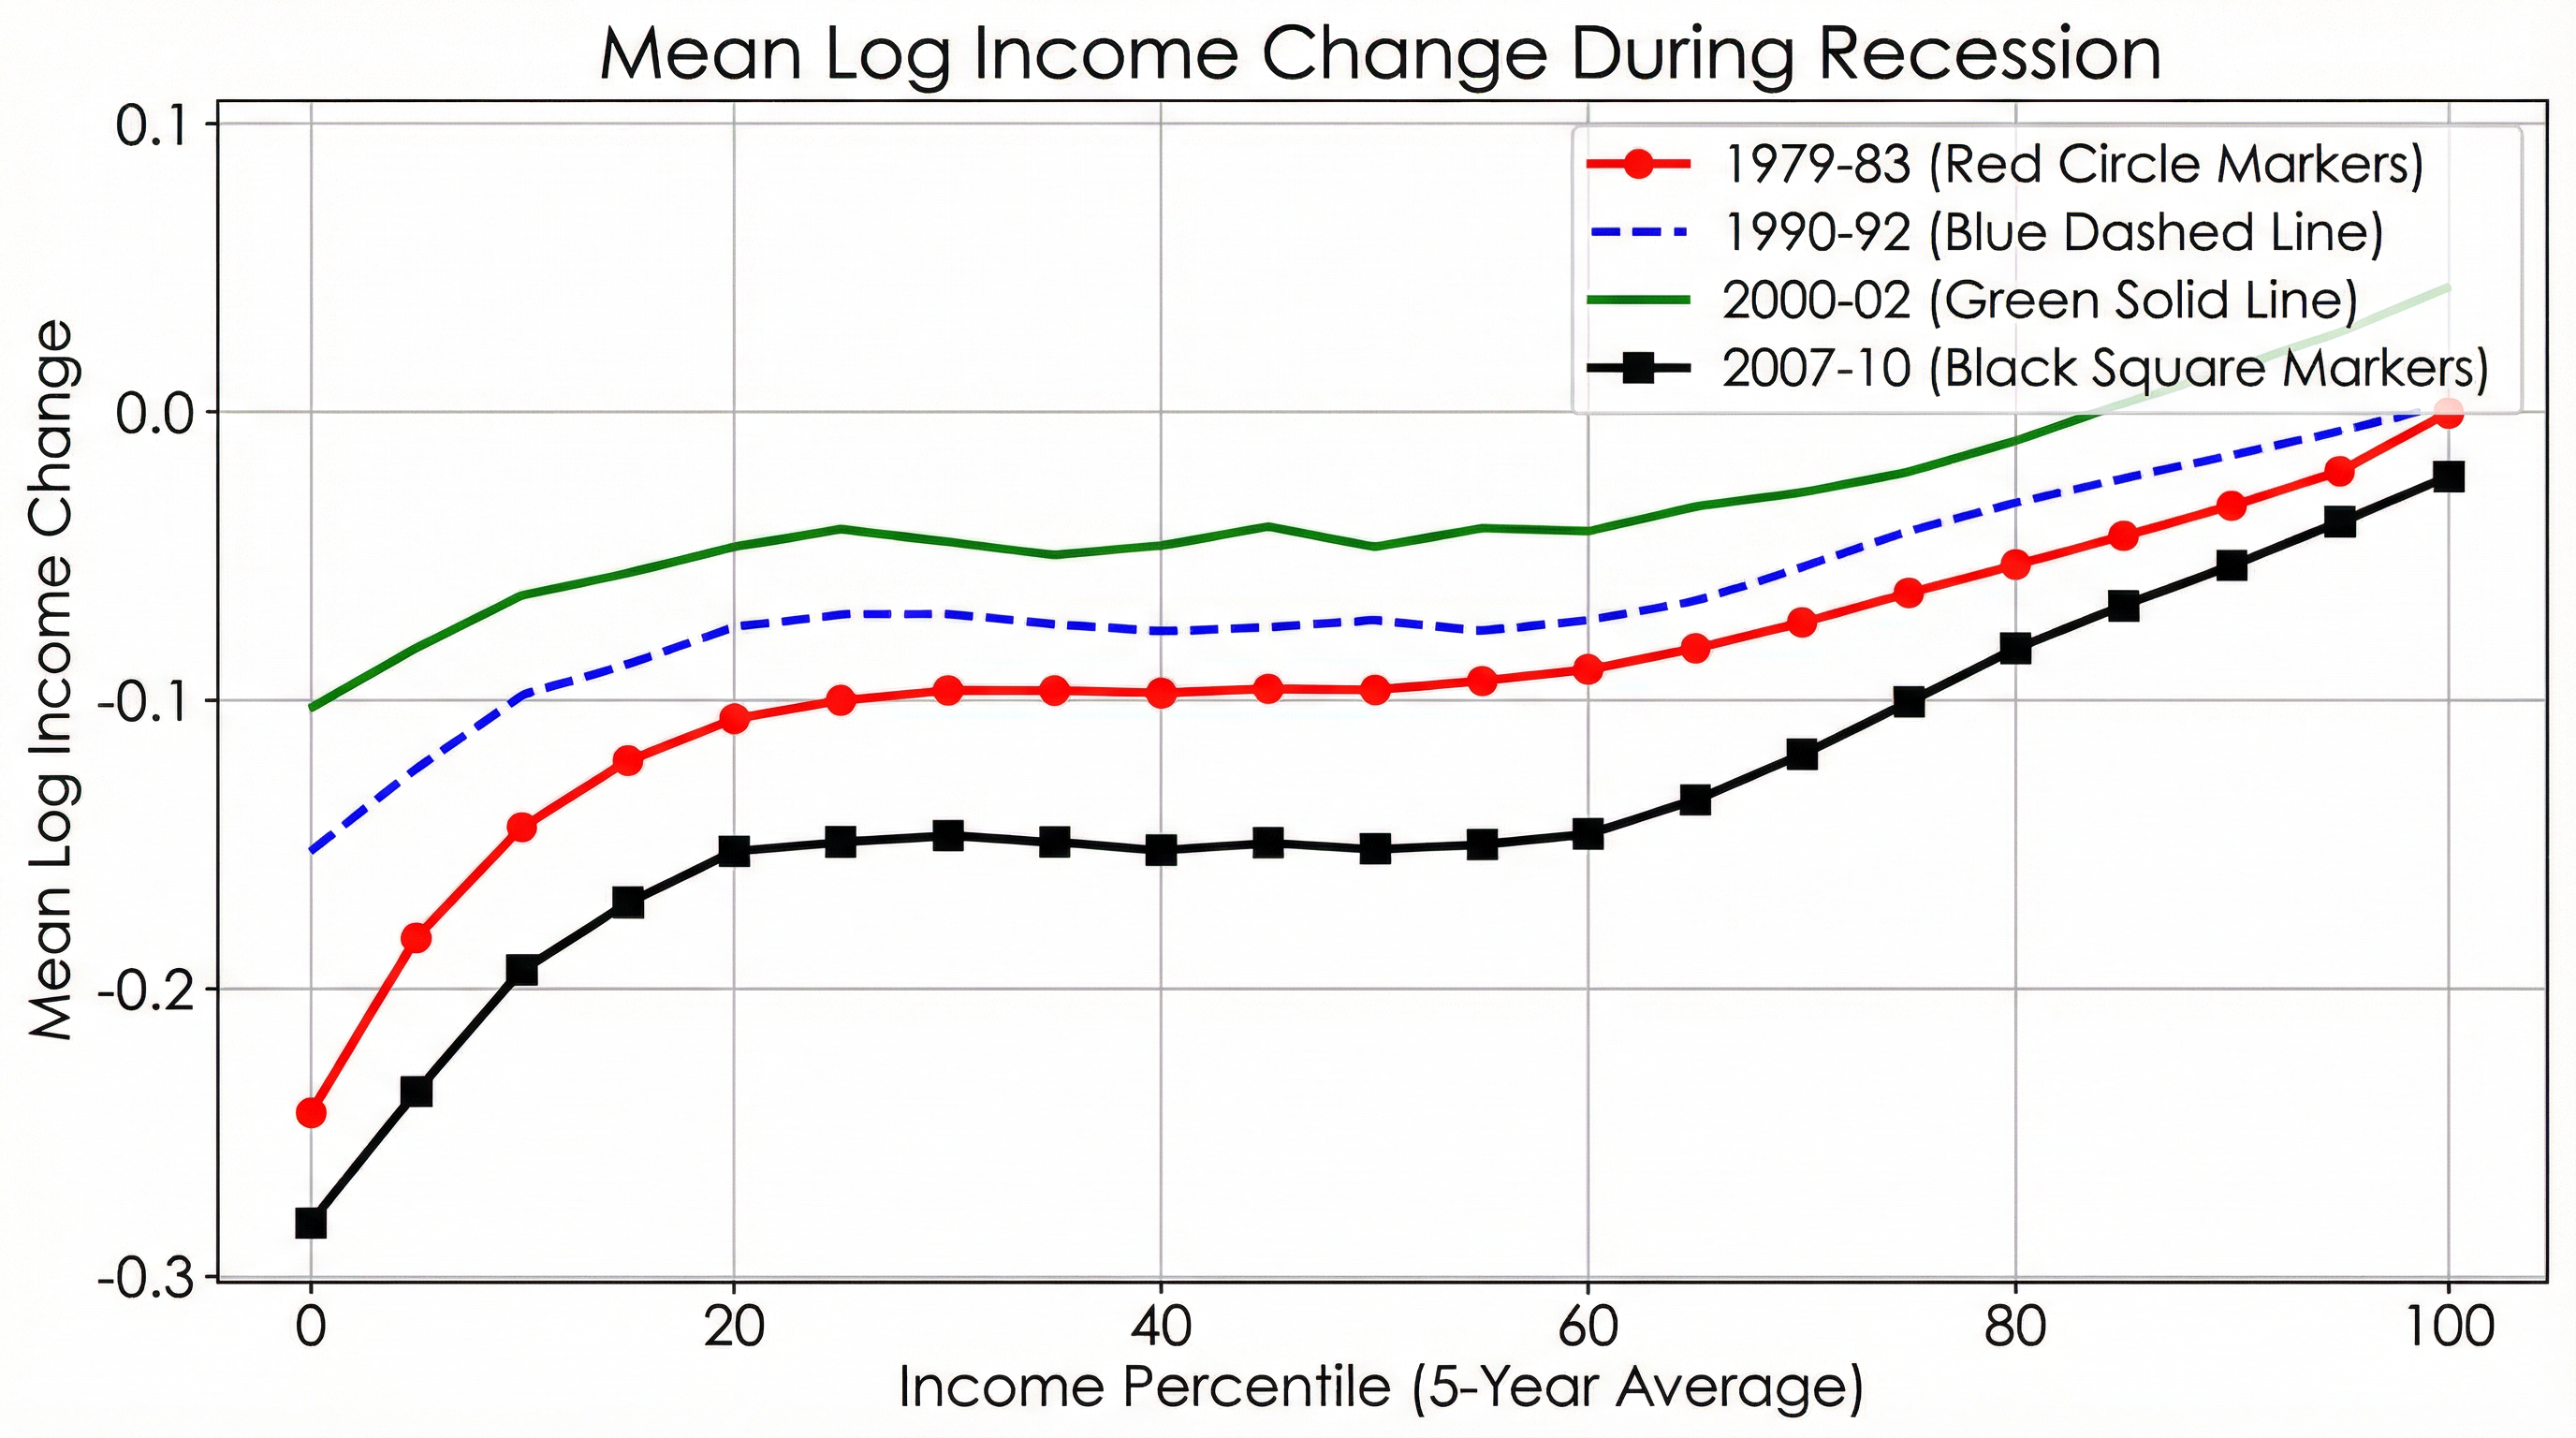
Unequal Recessions
Aggregate shocks are small in the data – standard deviation of output ≈ 3% in the U.S.
Small welfare gains from conventional stabilization policies
Burden of shocks is shared highly unequally
Large welfare gains from insurance
Insurance rather than redistribution
Gains and losses for households roughly even out over business cycle
Part III: Inflation & Money
Prices, Central Banks, and Credibility
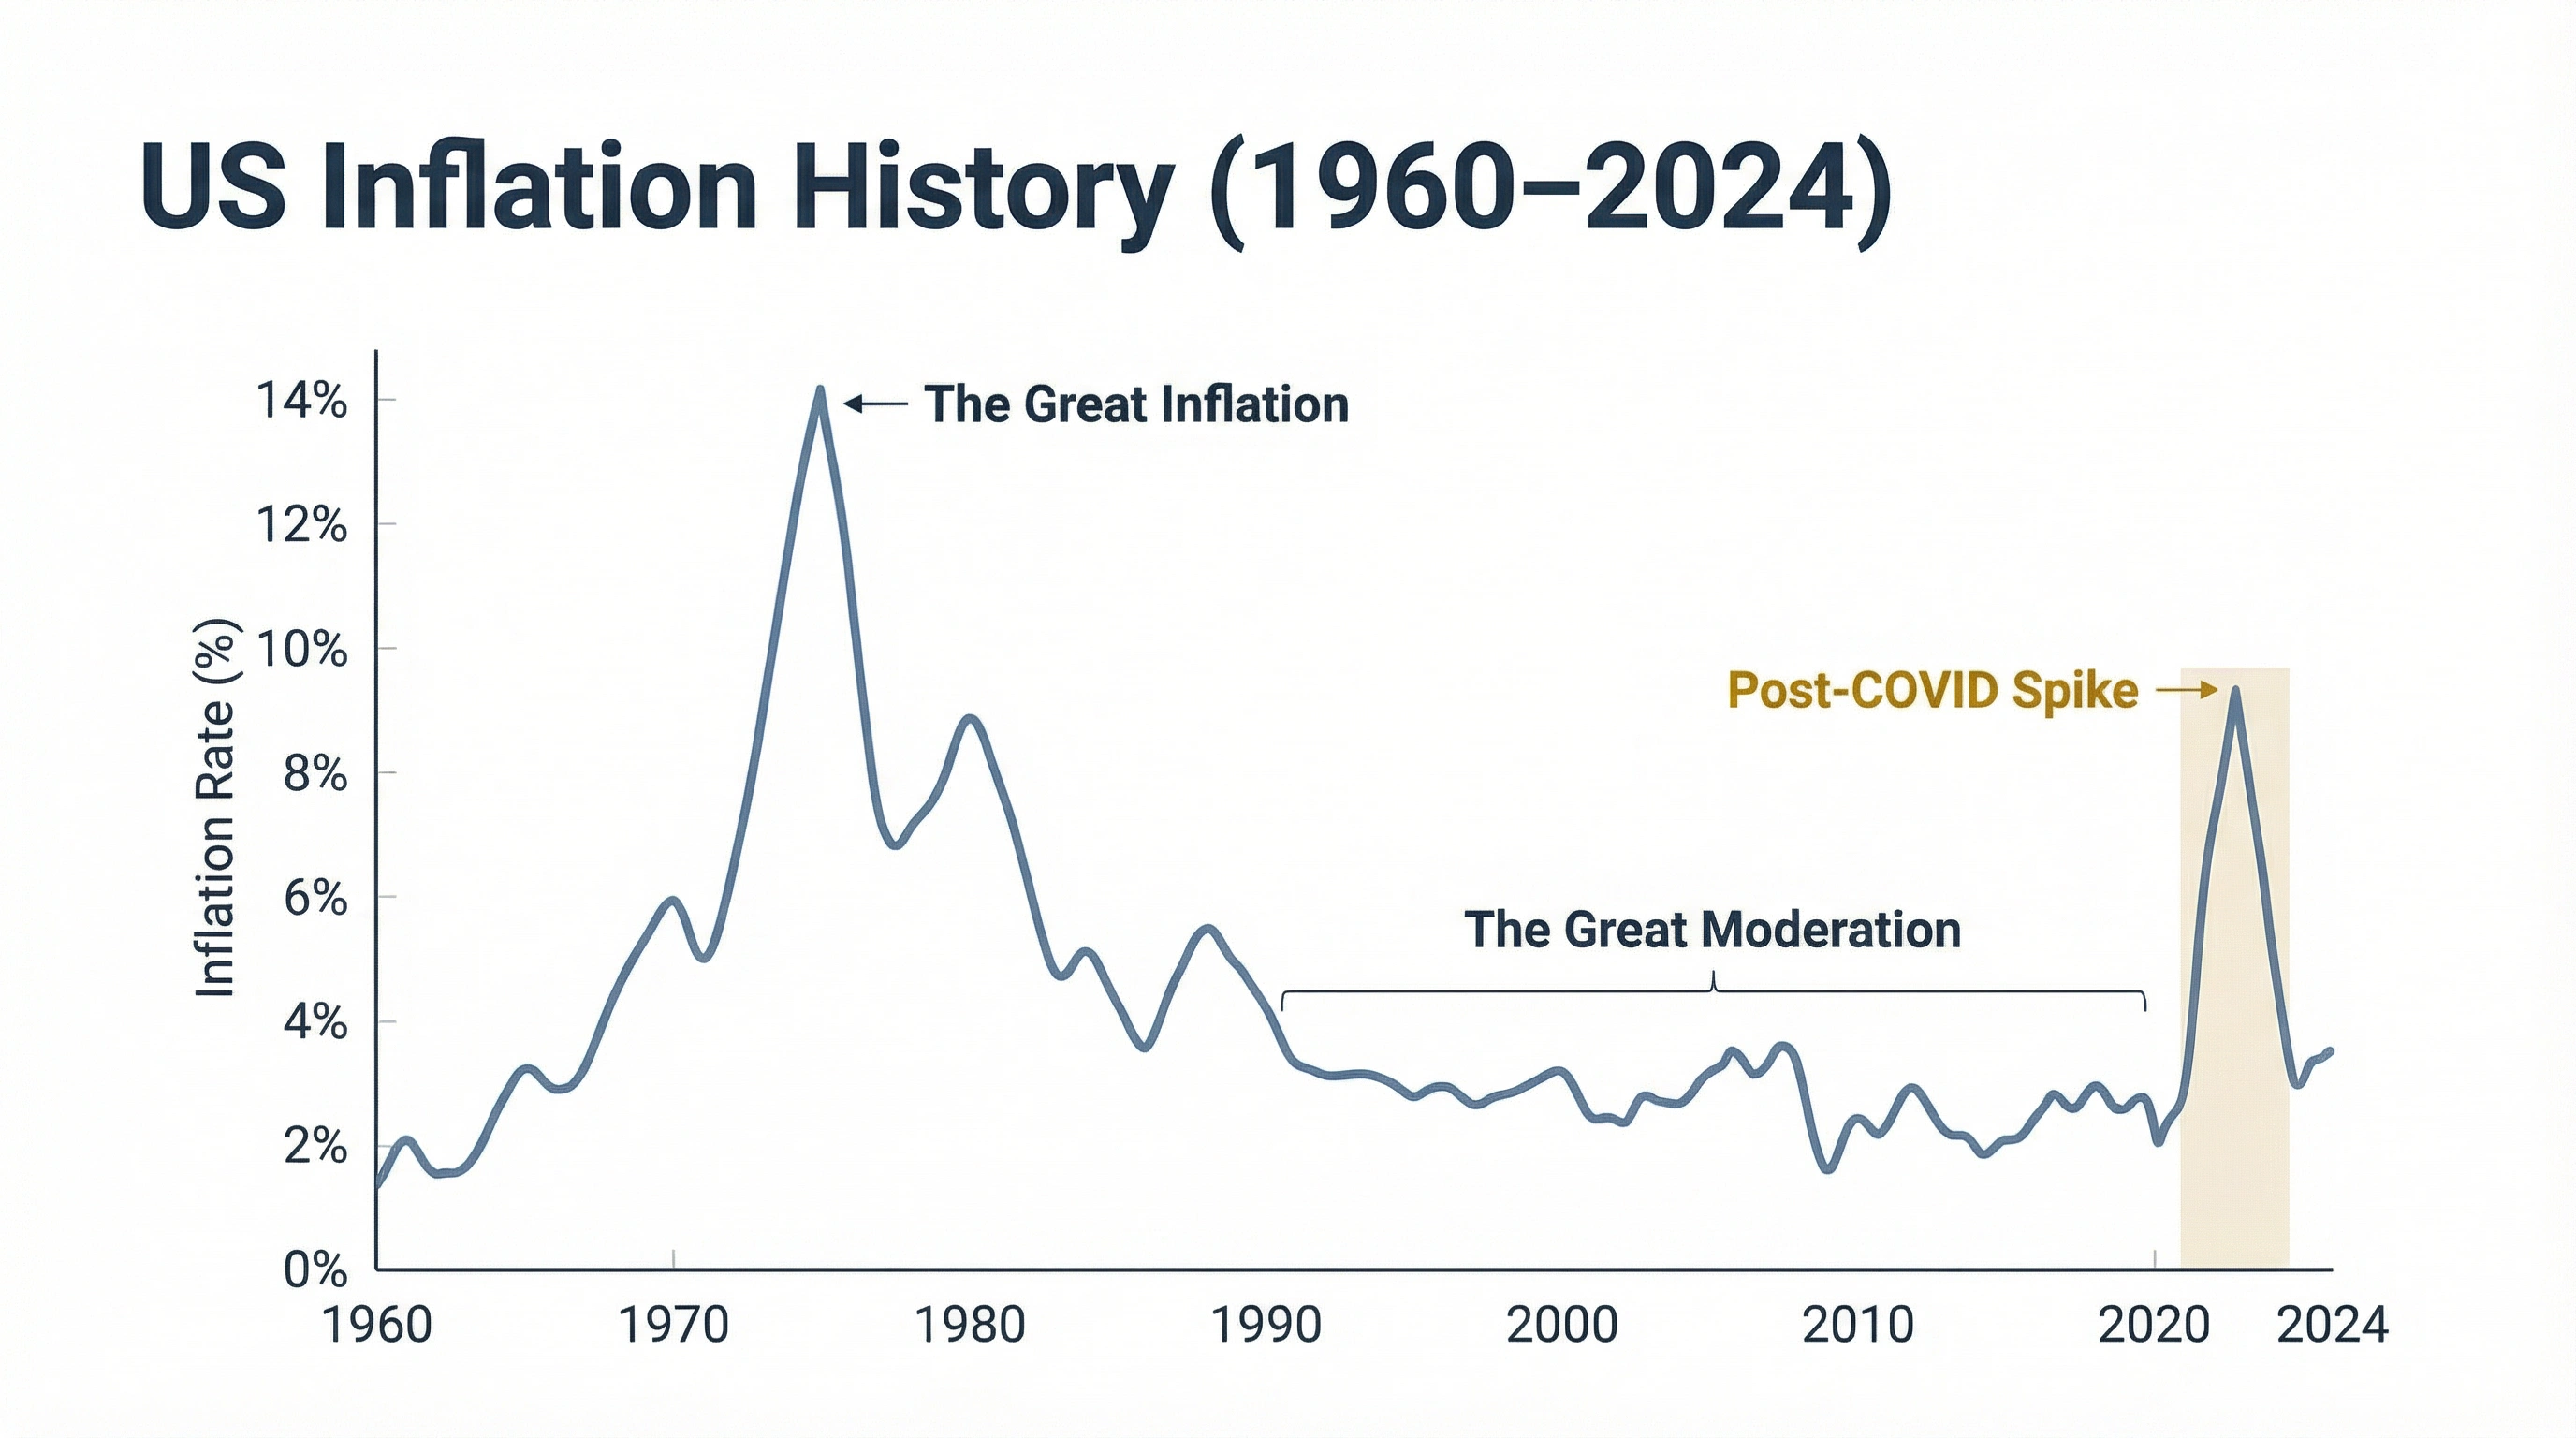
US Inflation History
From the Great Inflation to the COVID Spike
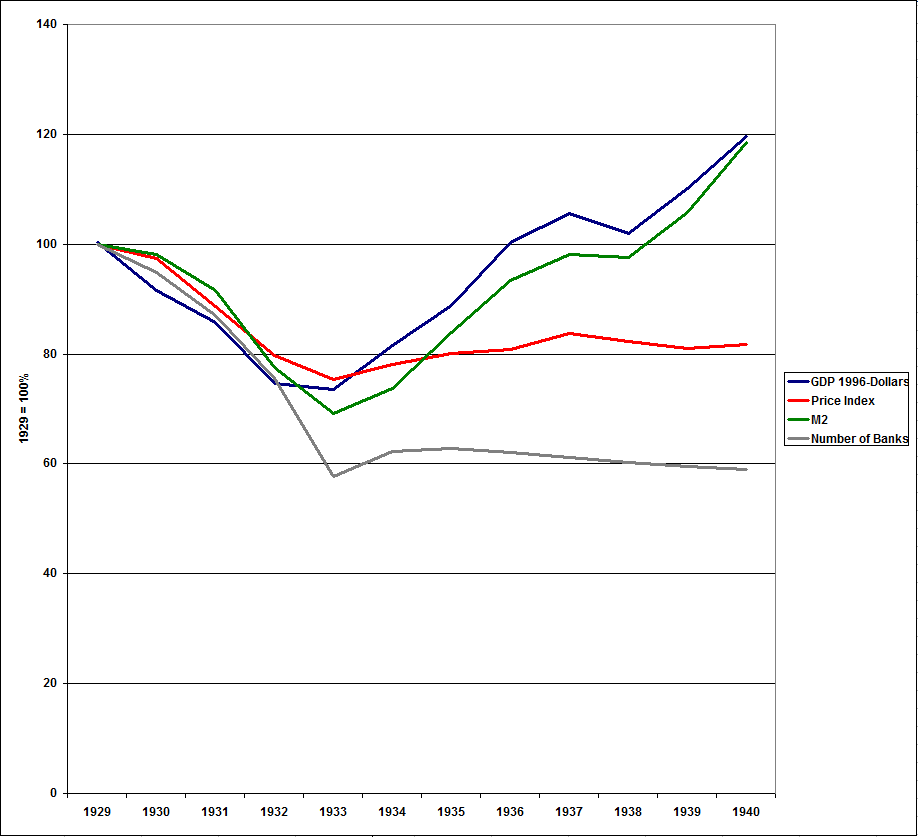
Monetary Policy in the Great Depression
The motivation for Friedman's work
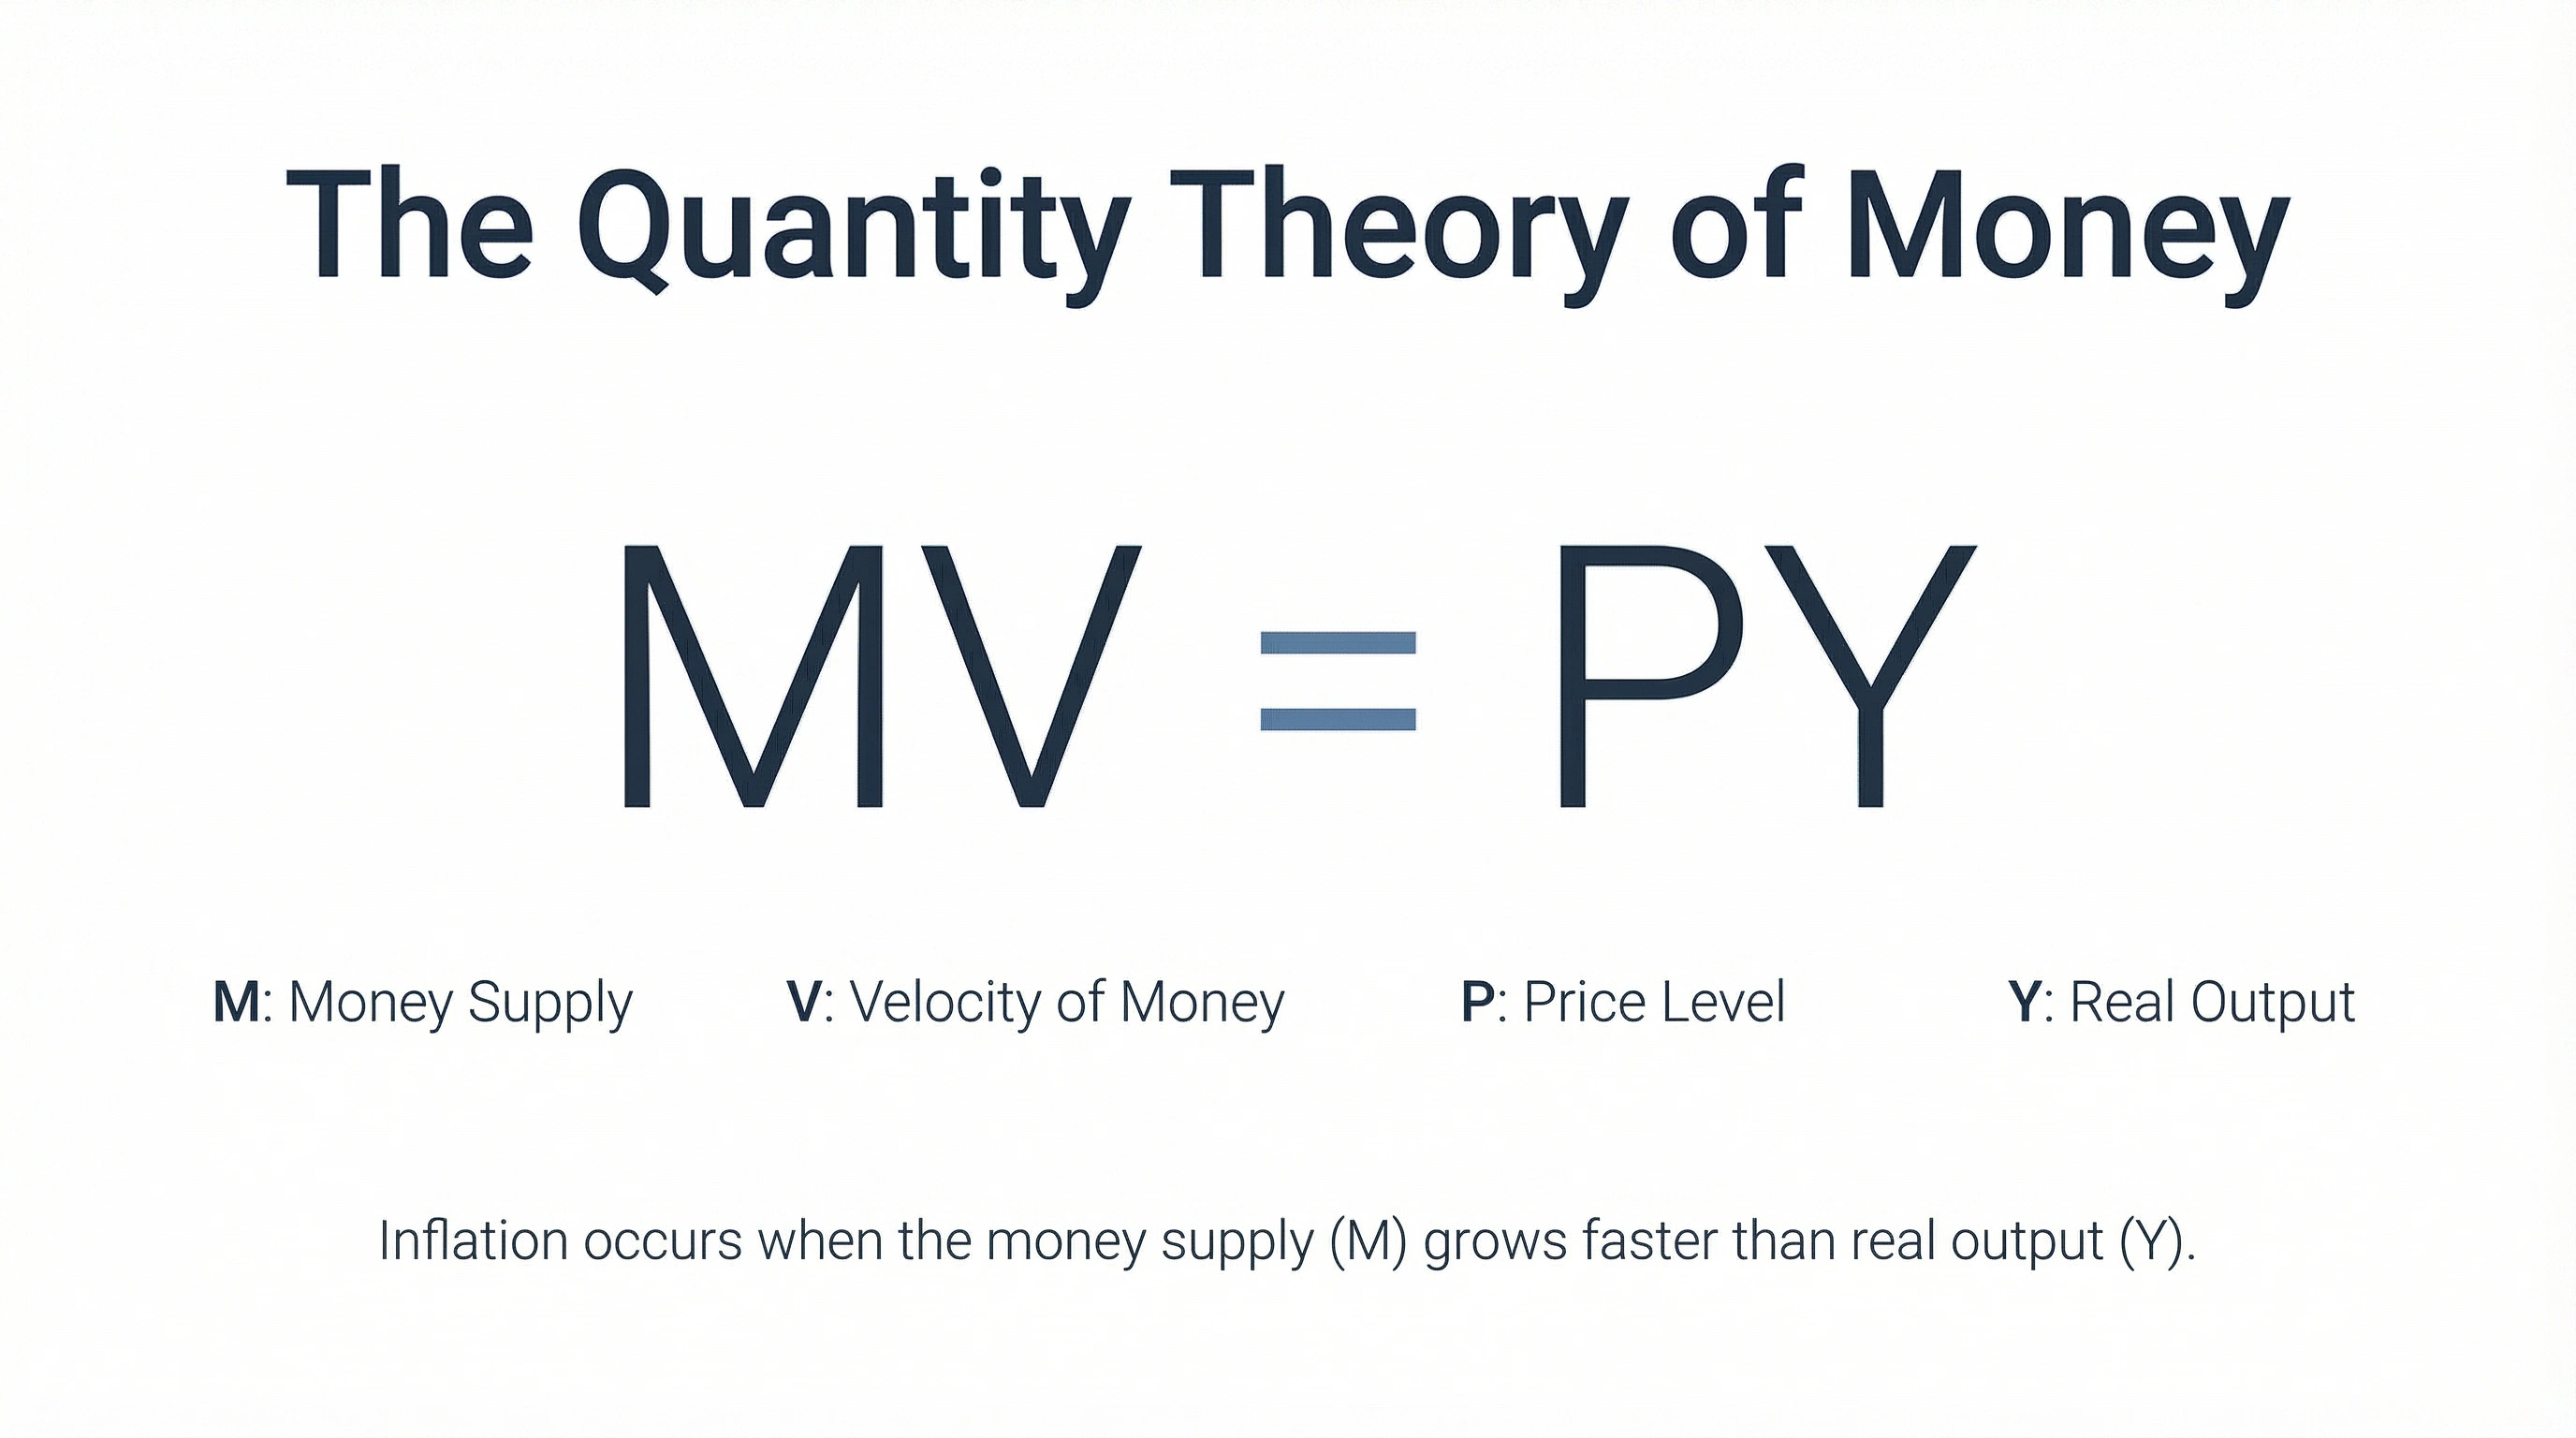
Quantity Theory of Money
MV = PY
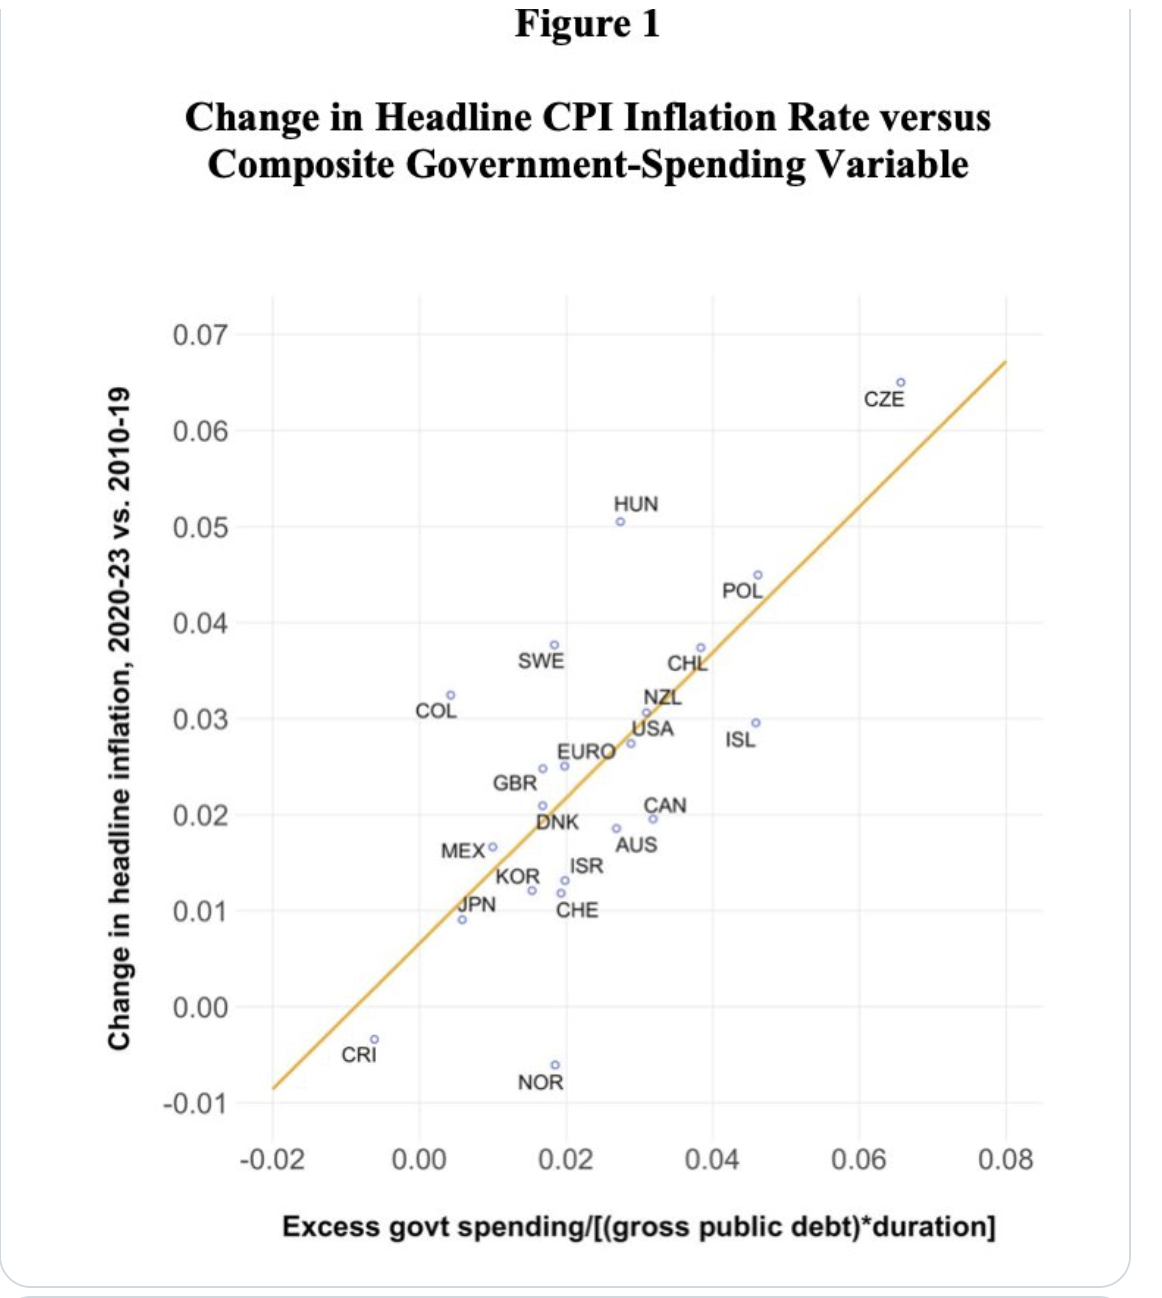
Government Spending and Inflation
Cross-country evidence from 2020-2023
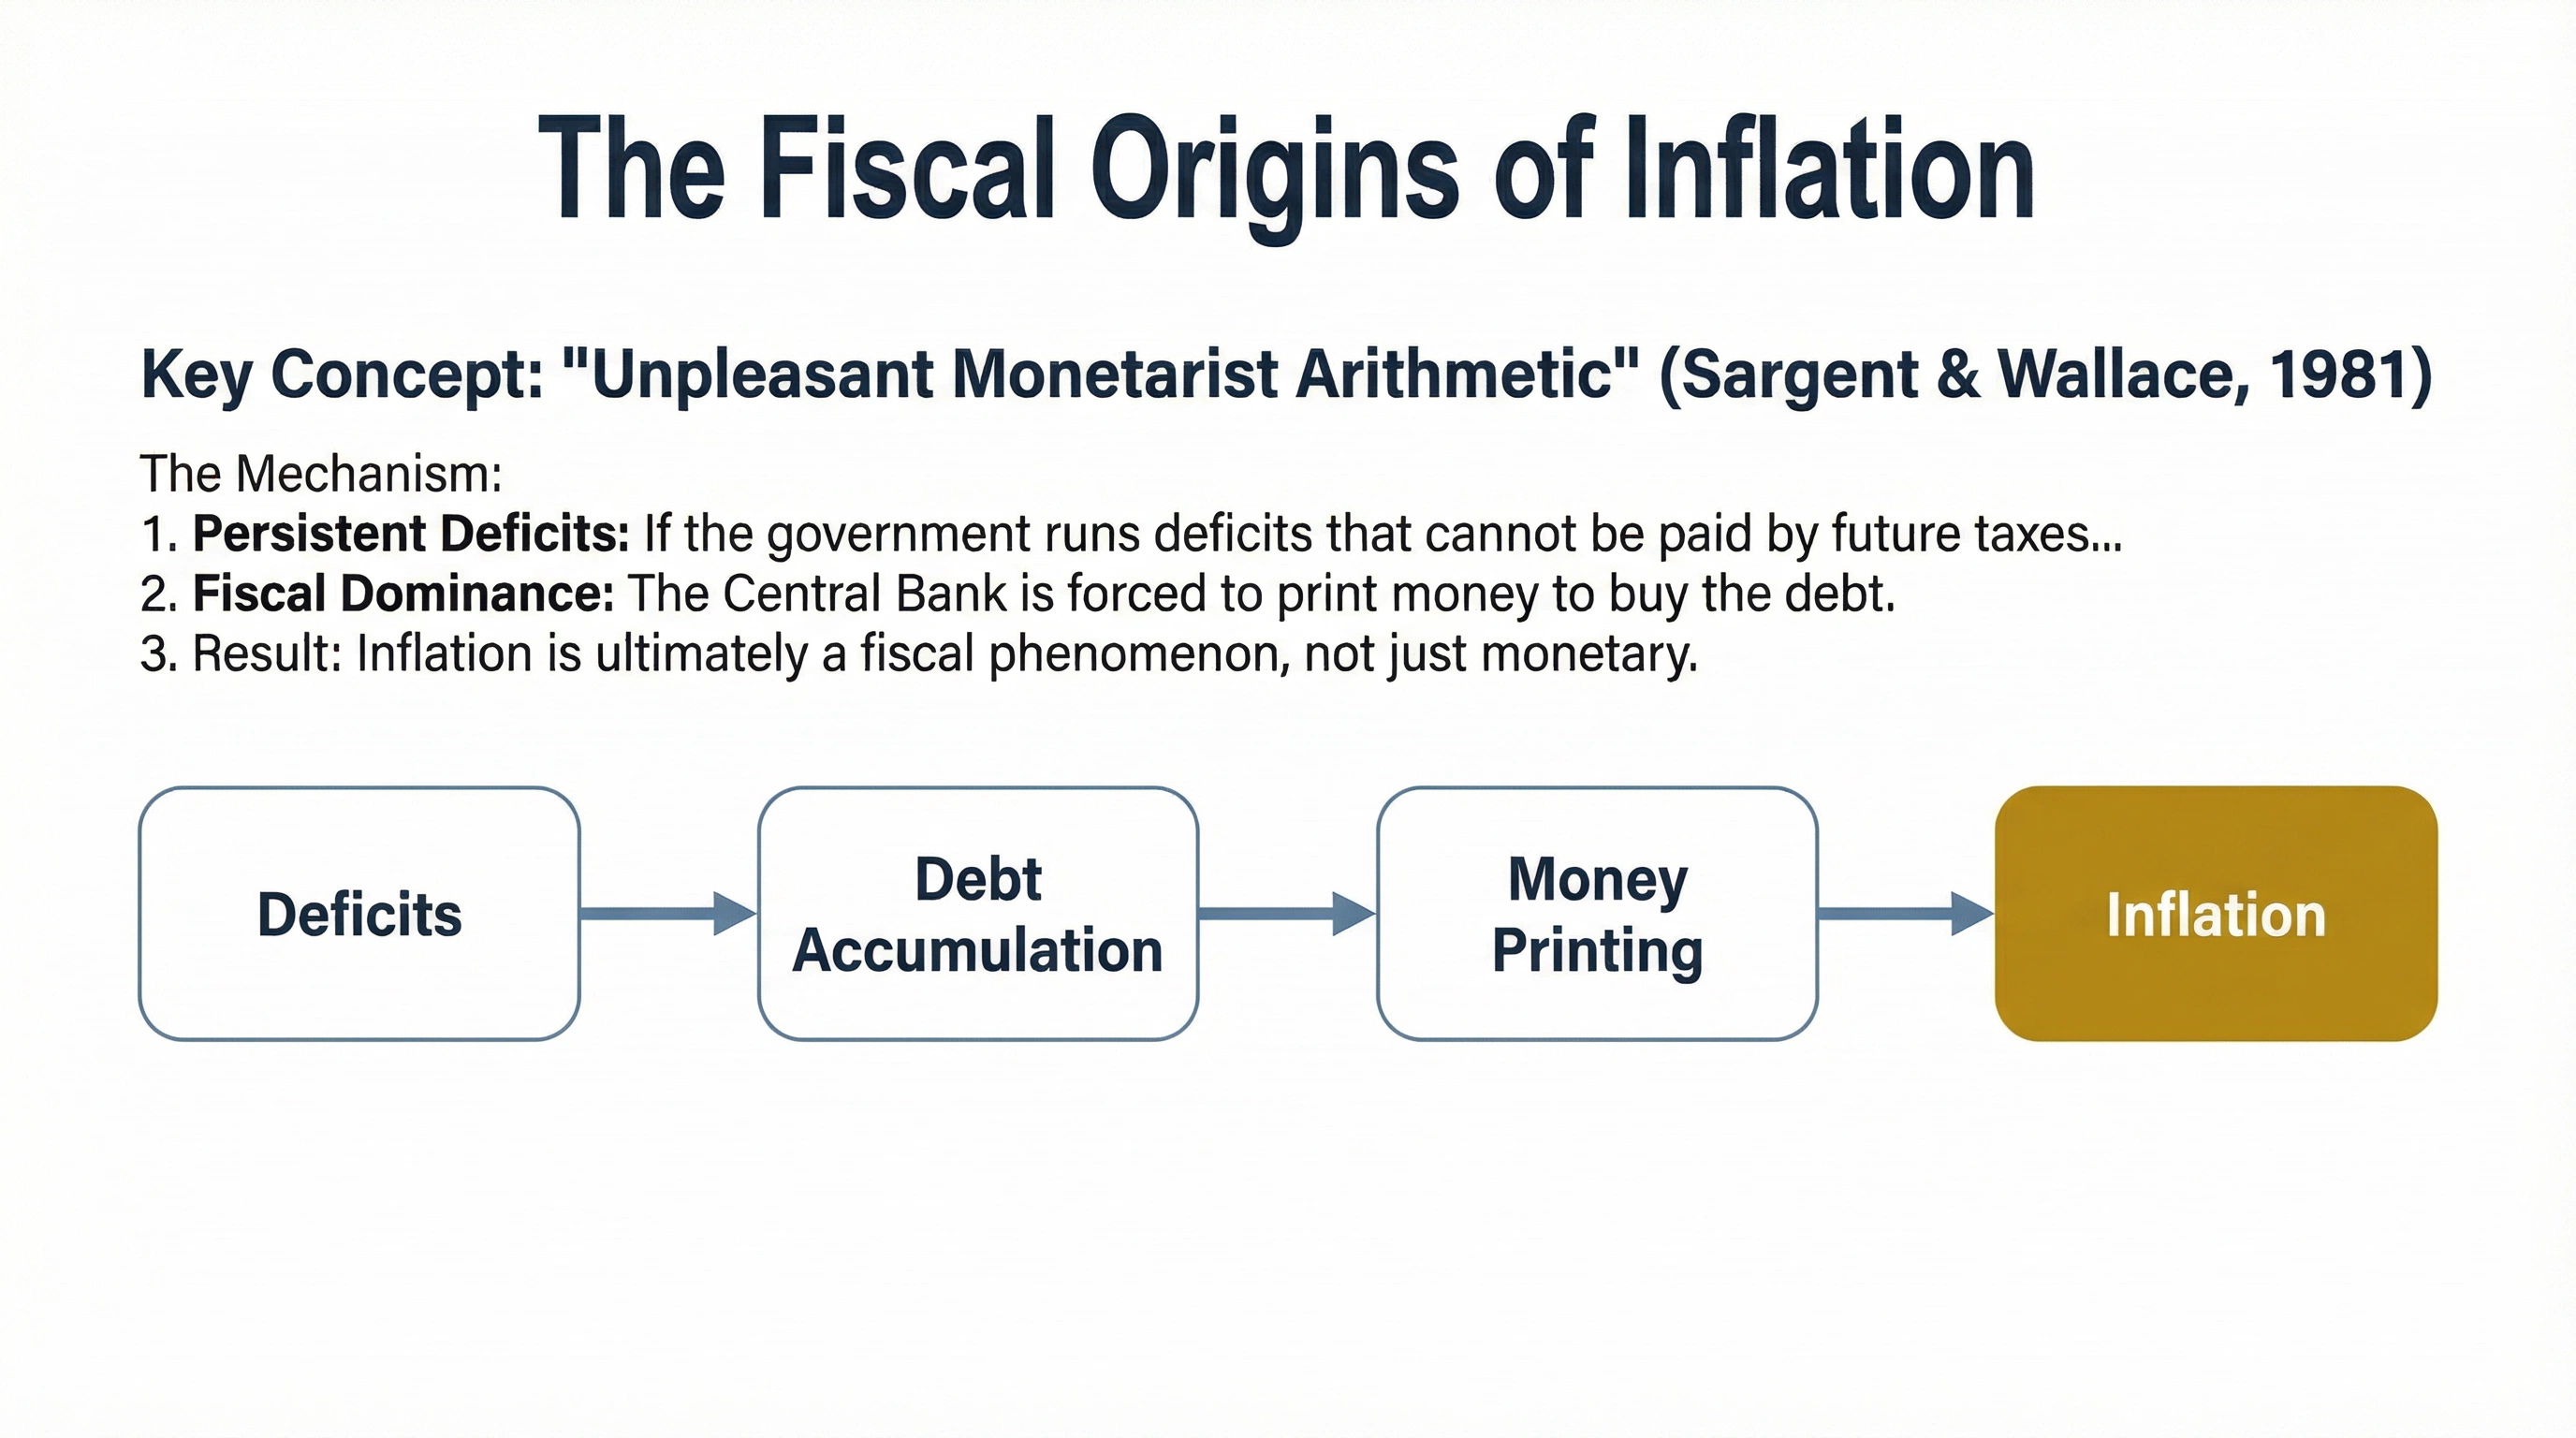
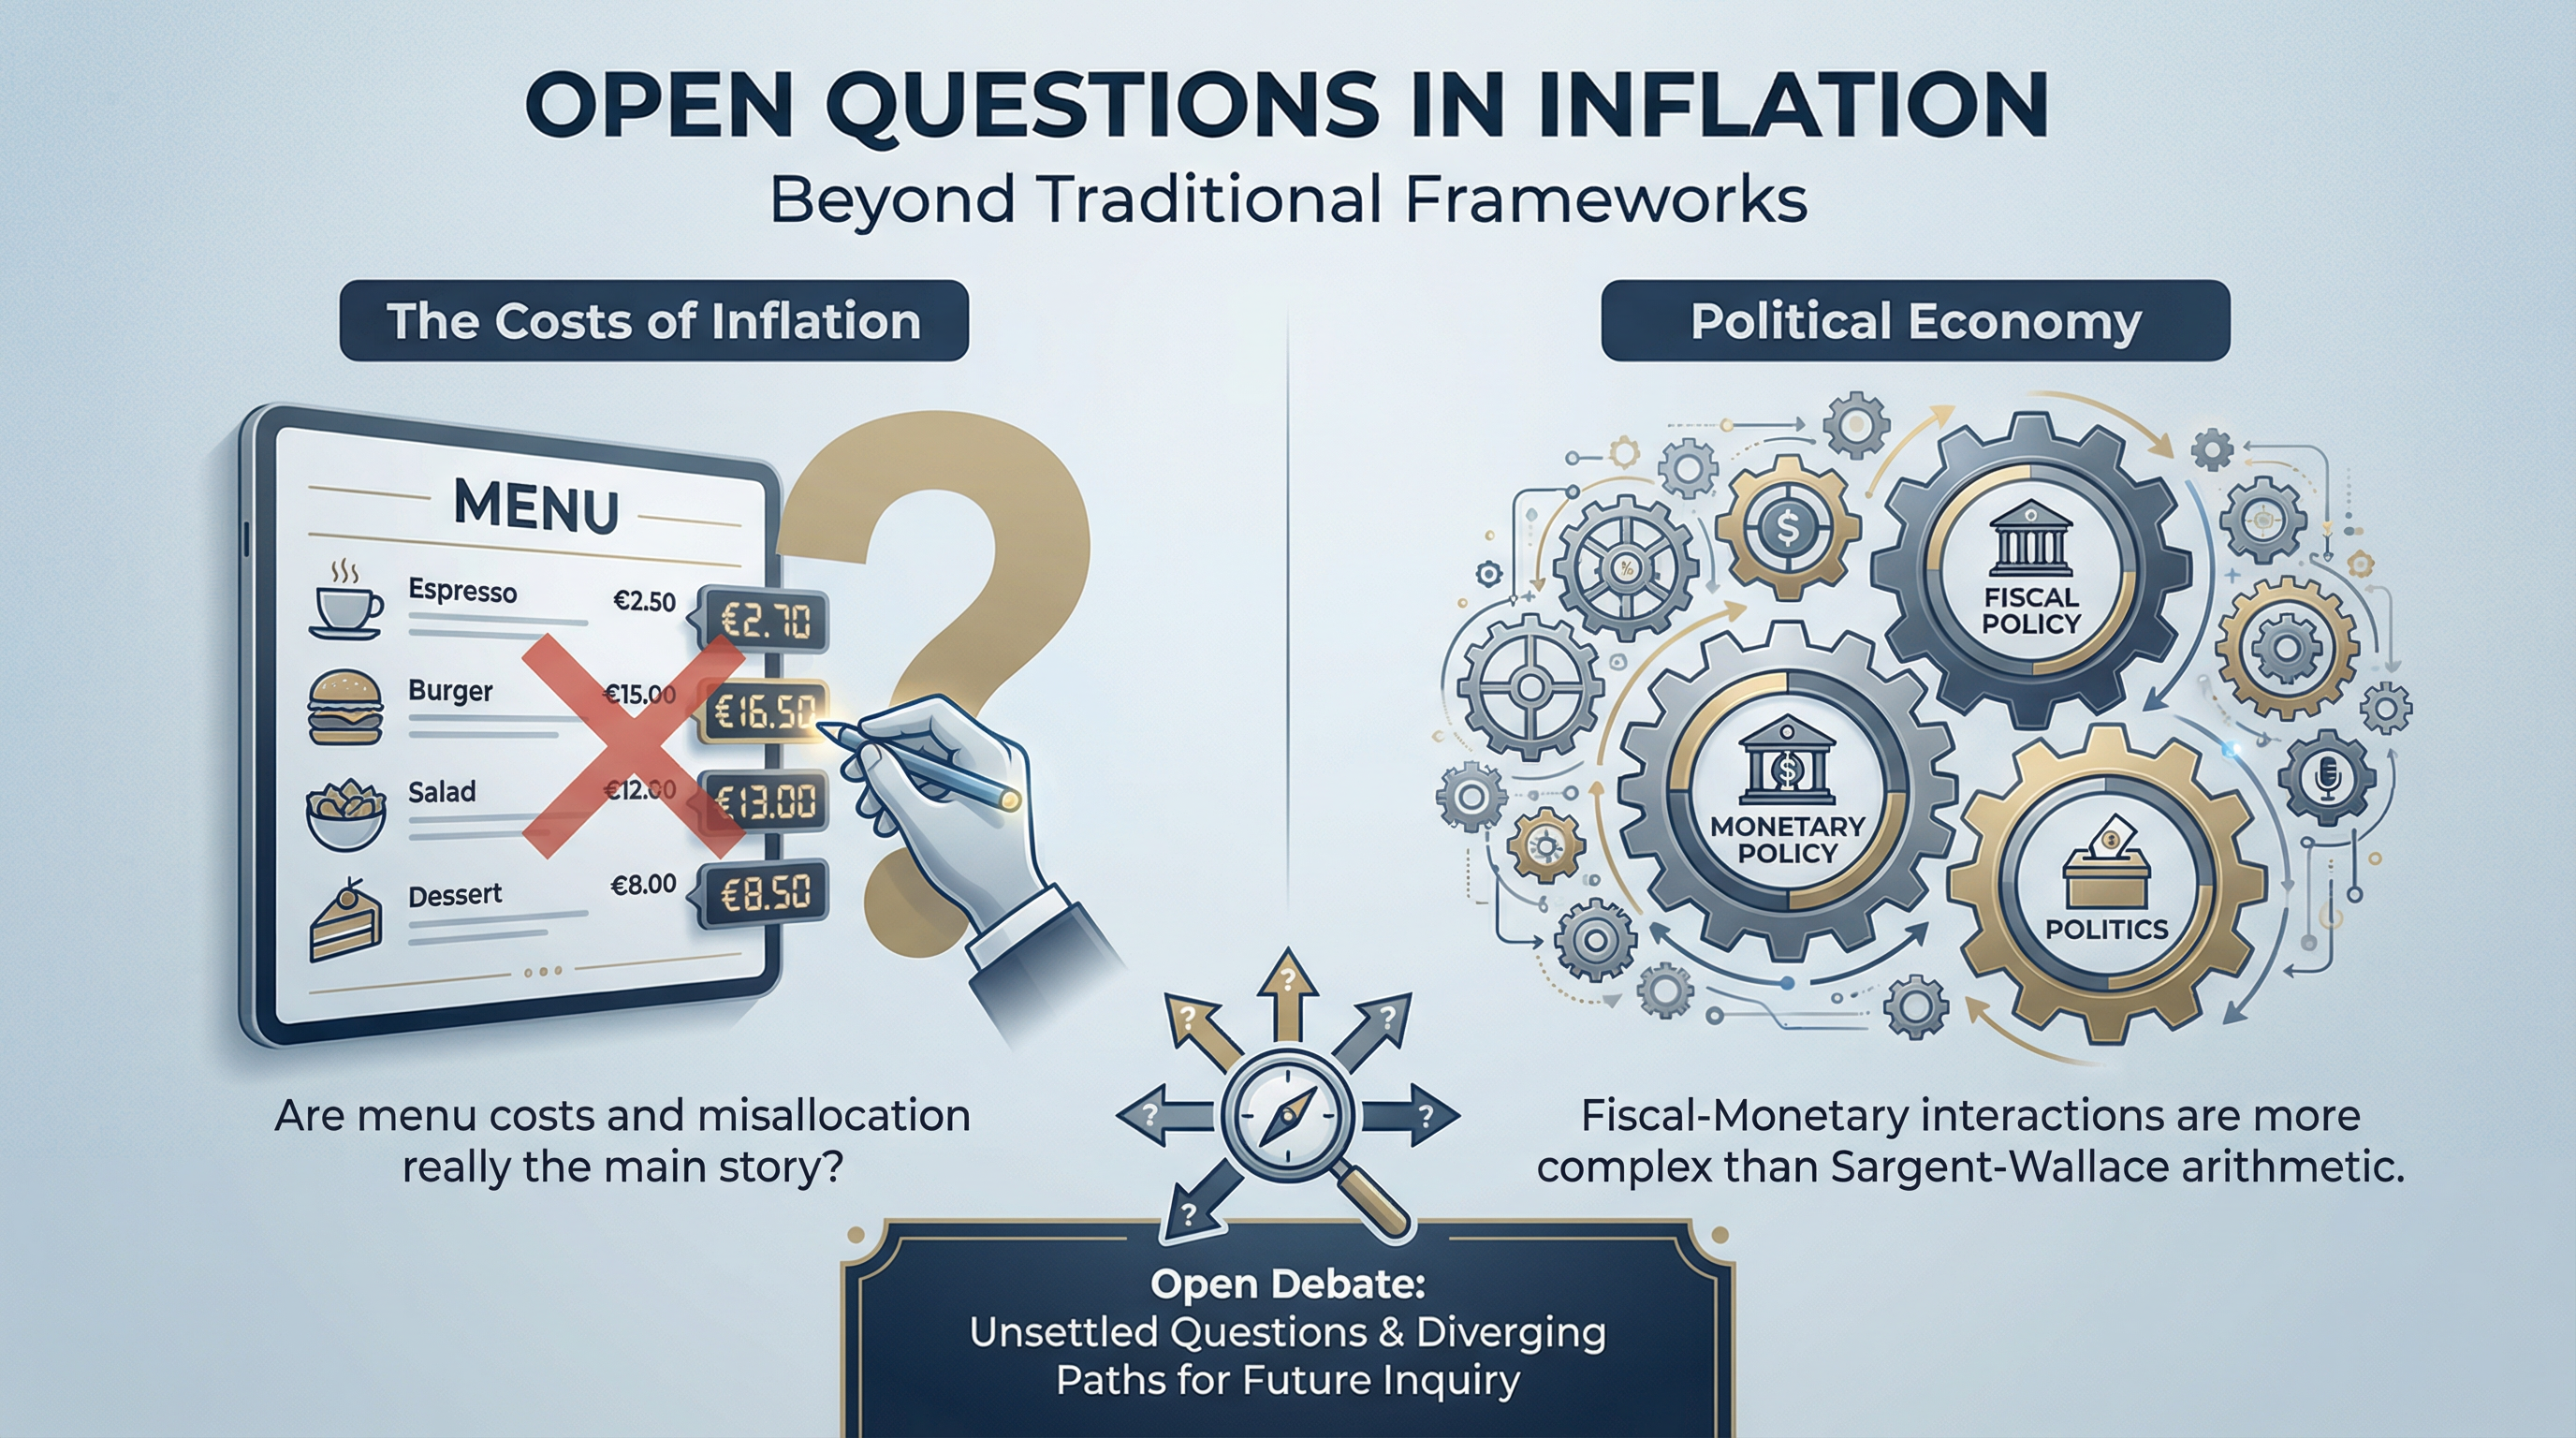
Fiscal Origins of Inflation
Unpleasant Monetarist Arithmetic
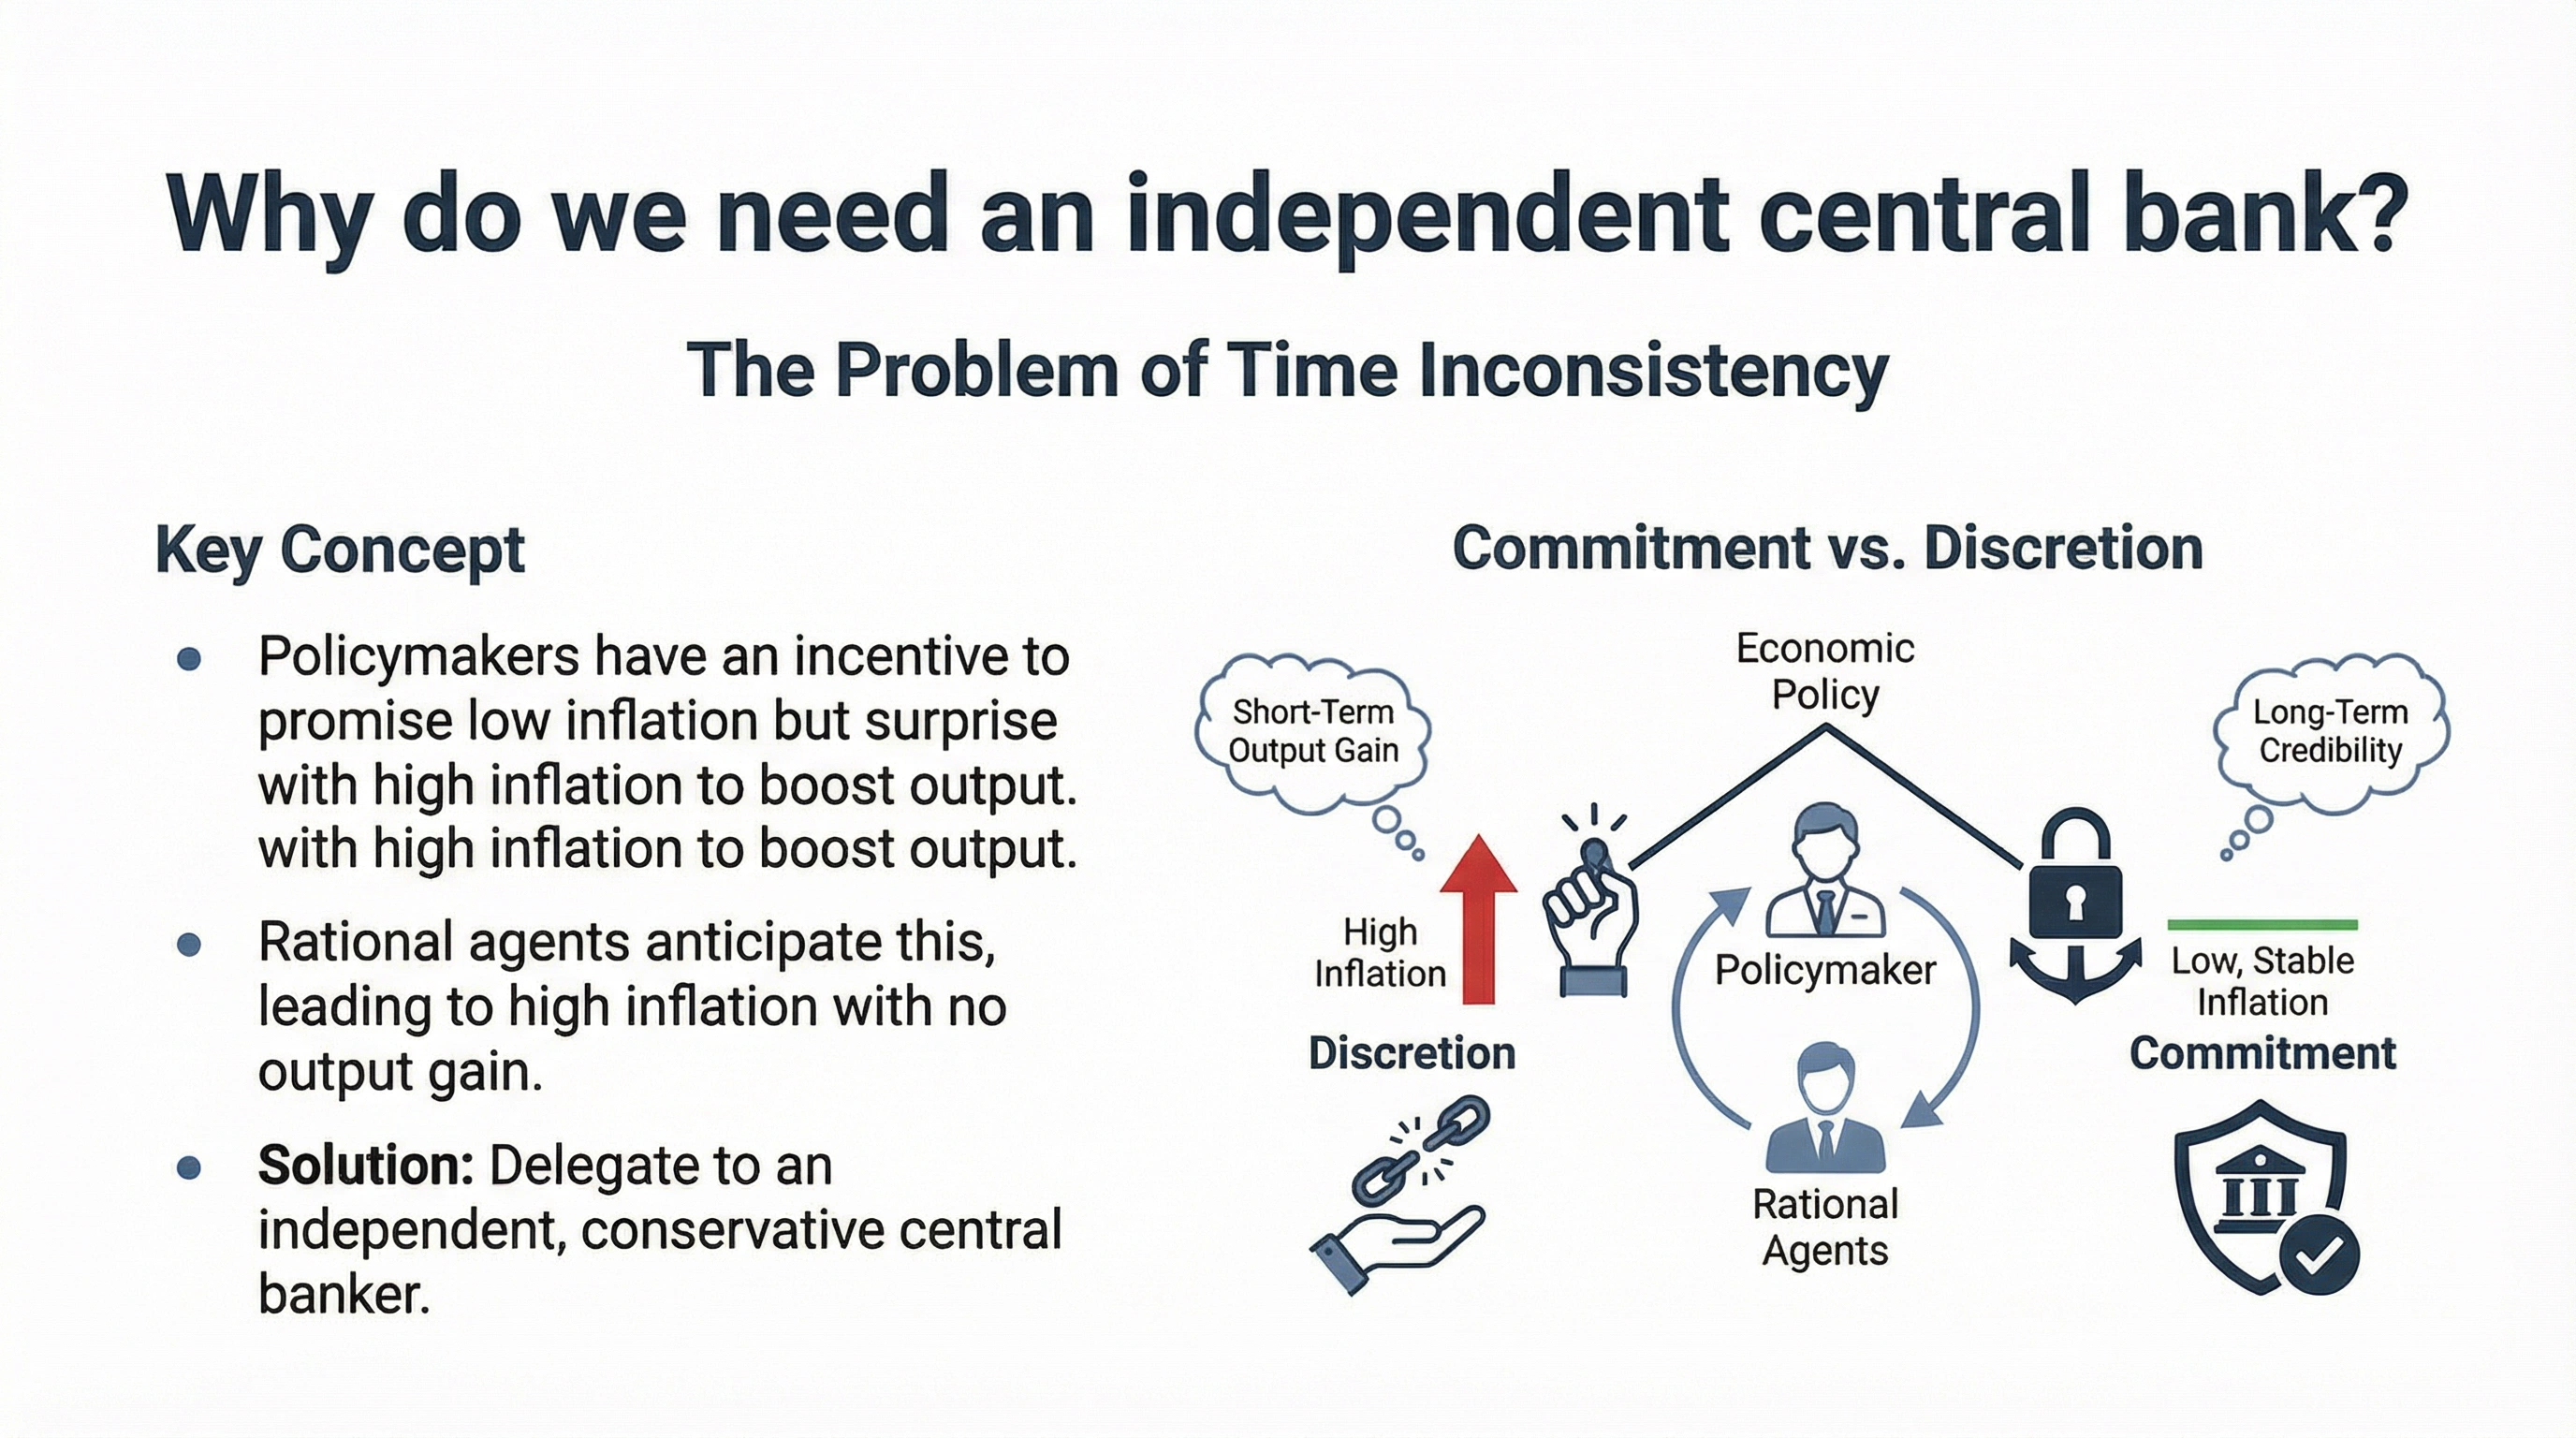
Why do we need an independent central bank?
The Problem of Time Inconsistency
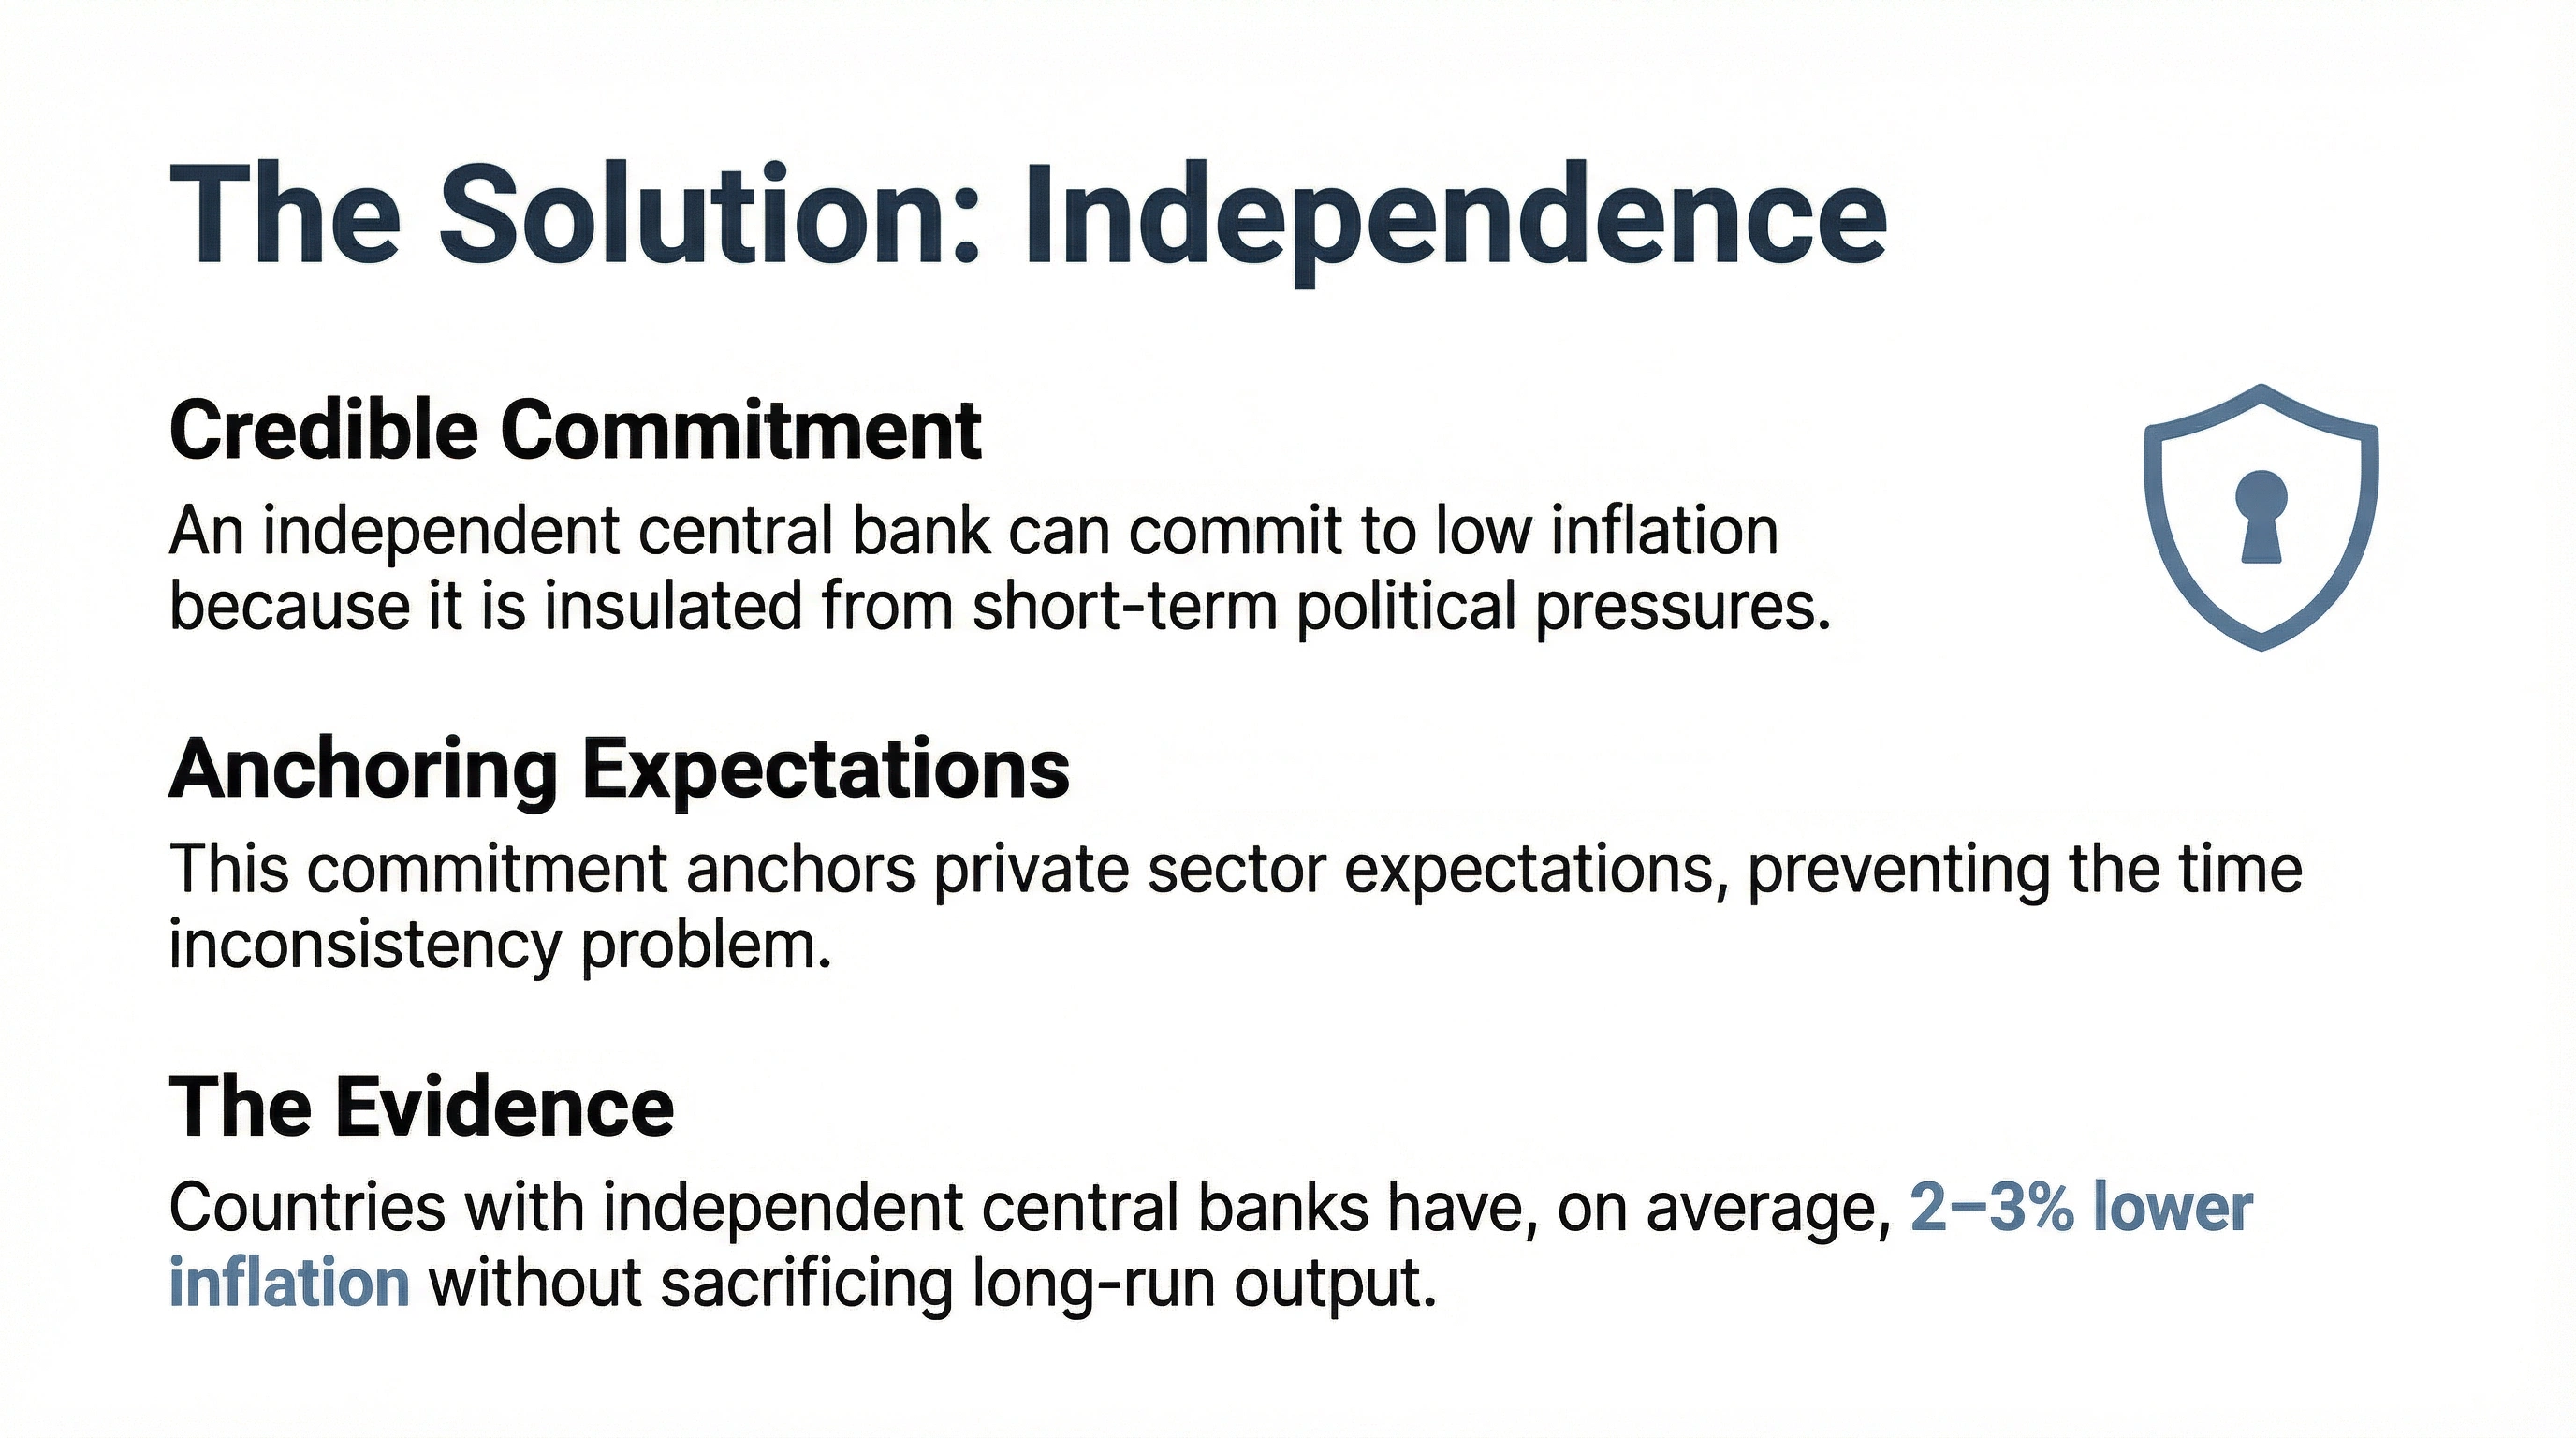
Central Bank Independence
The solution to credibility
Open Questions in Inflation
Beyond traditional frameworks
Part IV: Inequality
Distribution, Technology, and Fairness
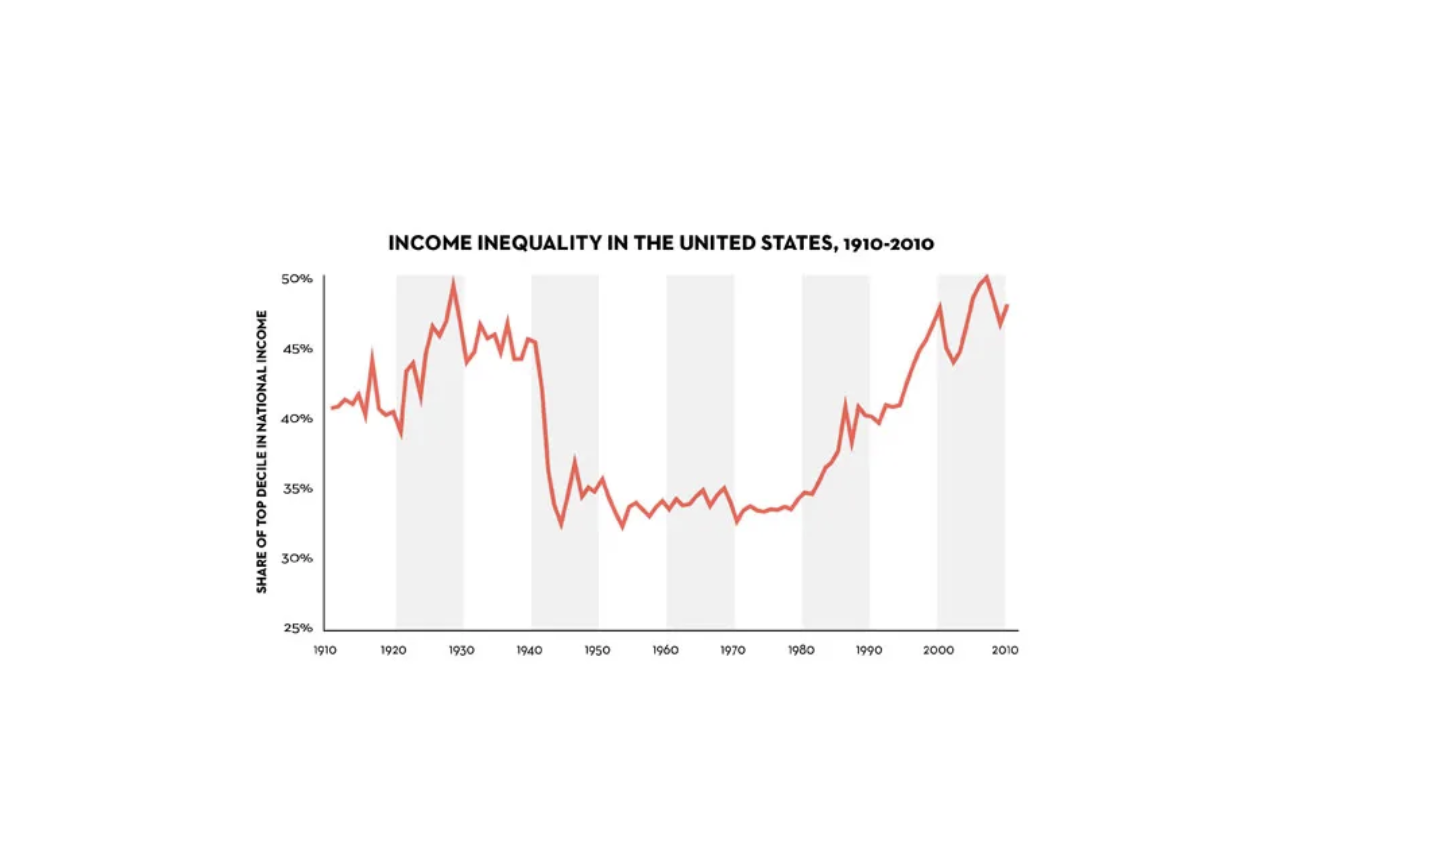
The Great Inequality Debate
Piketty's provocative findings on long-run inequality
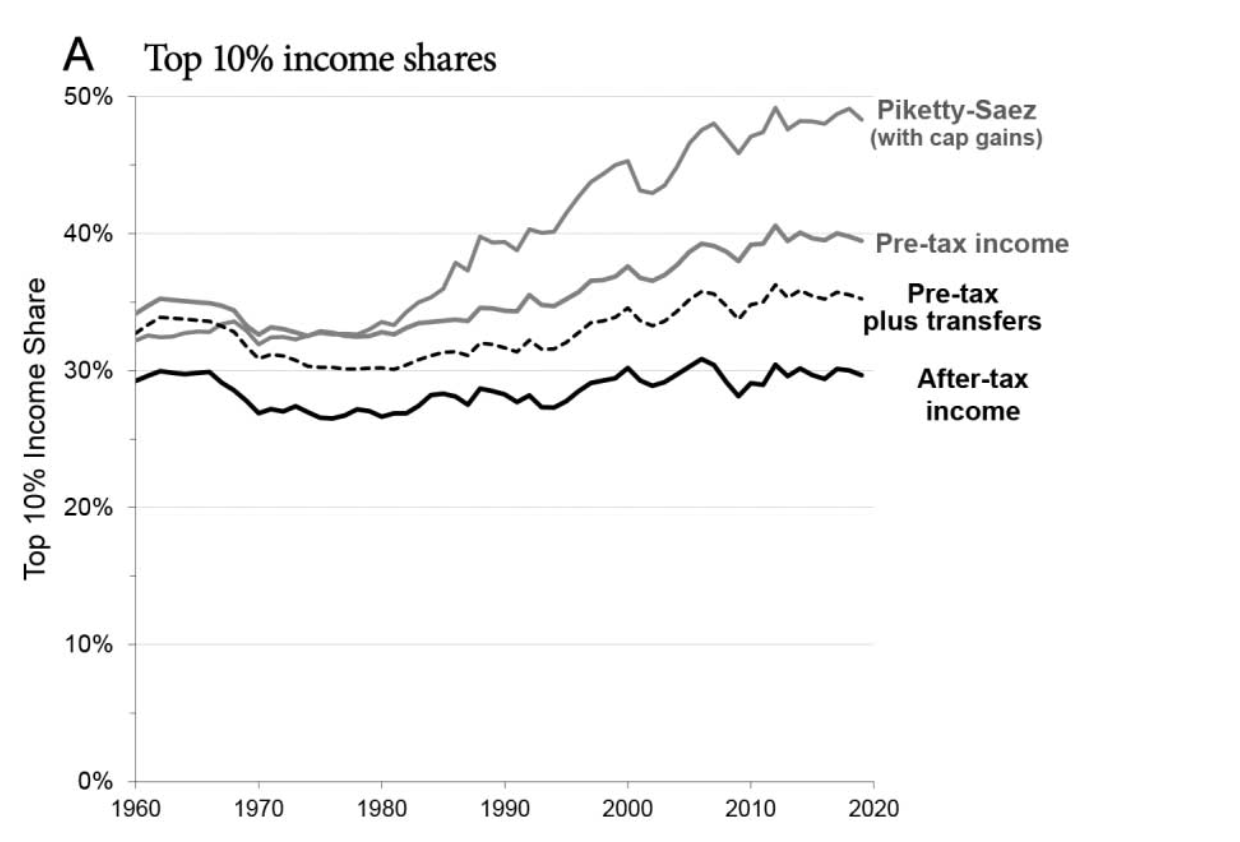
Measurement Matters: Top 10%
Piketty-Saez vs. Pre-tax Income with Transfers
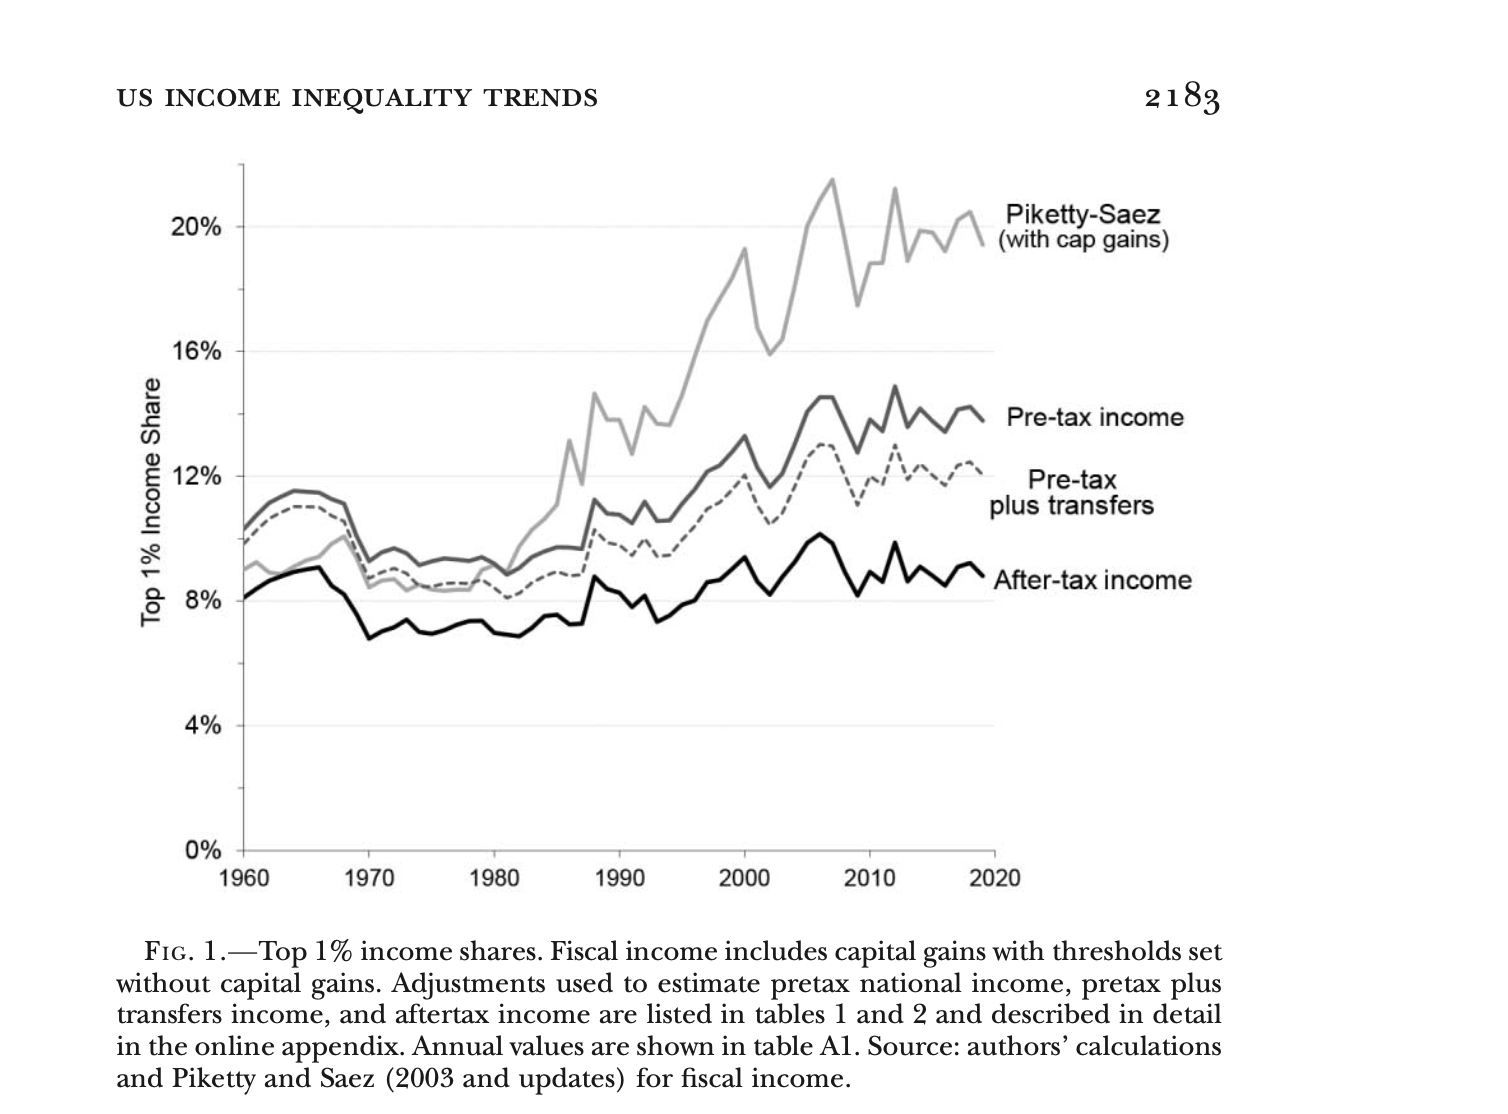
Measurement Matters: Top 1%
Auten & Splinter show Piketty overstates the increase
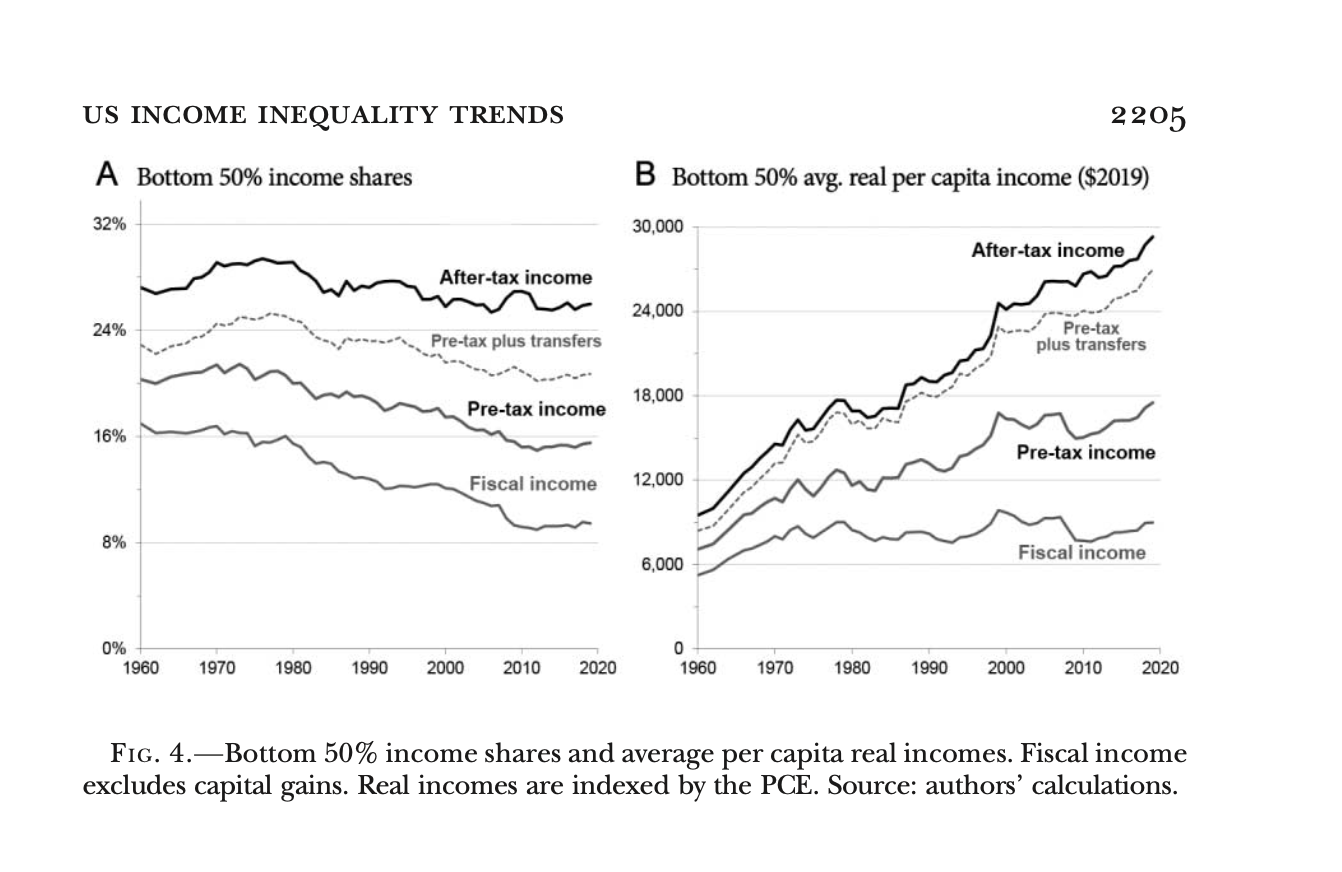
What About the Bottom 50%?
Income shares and real per capita income trends
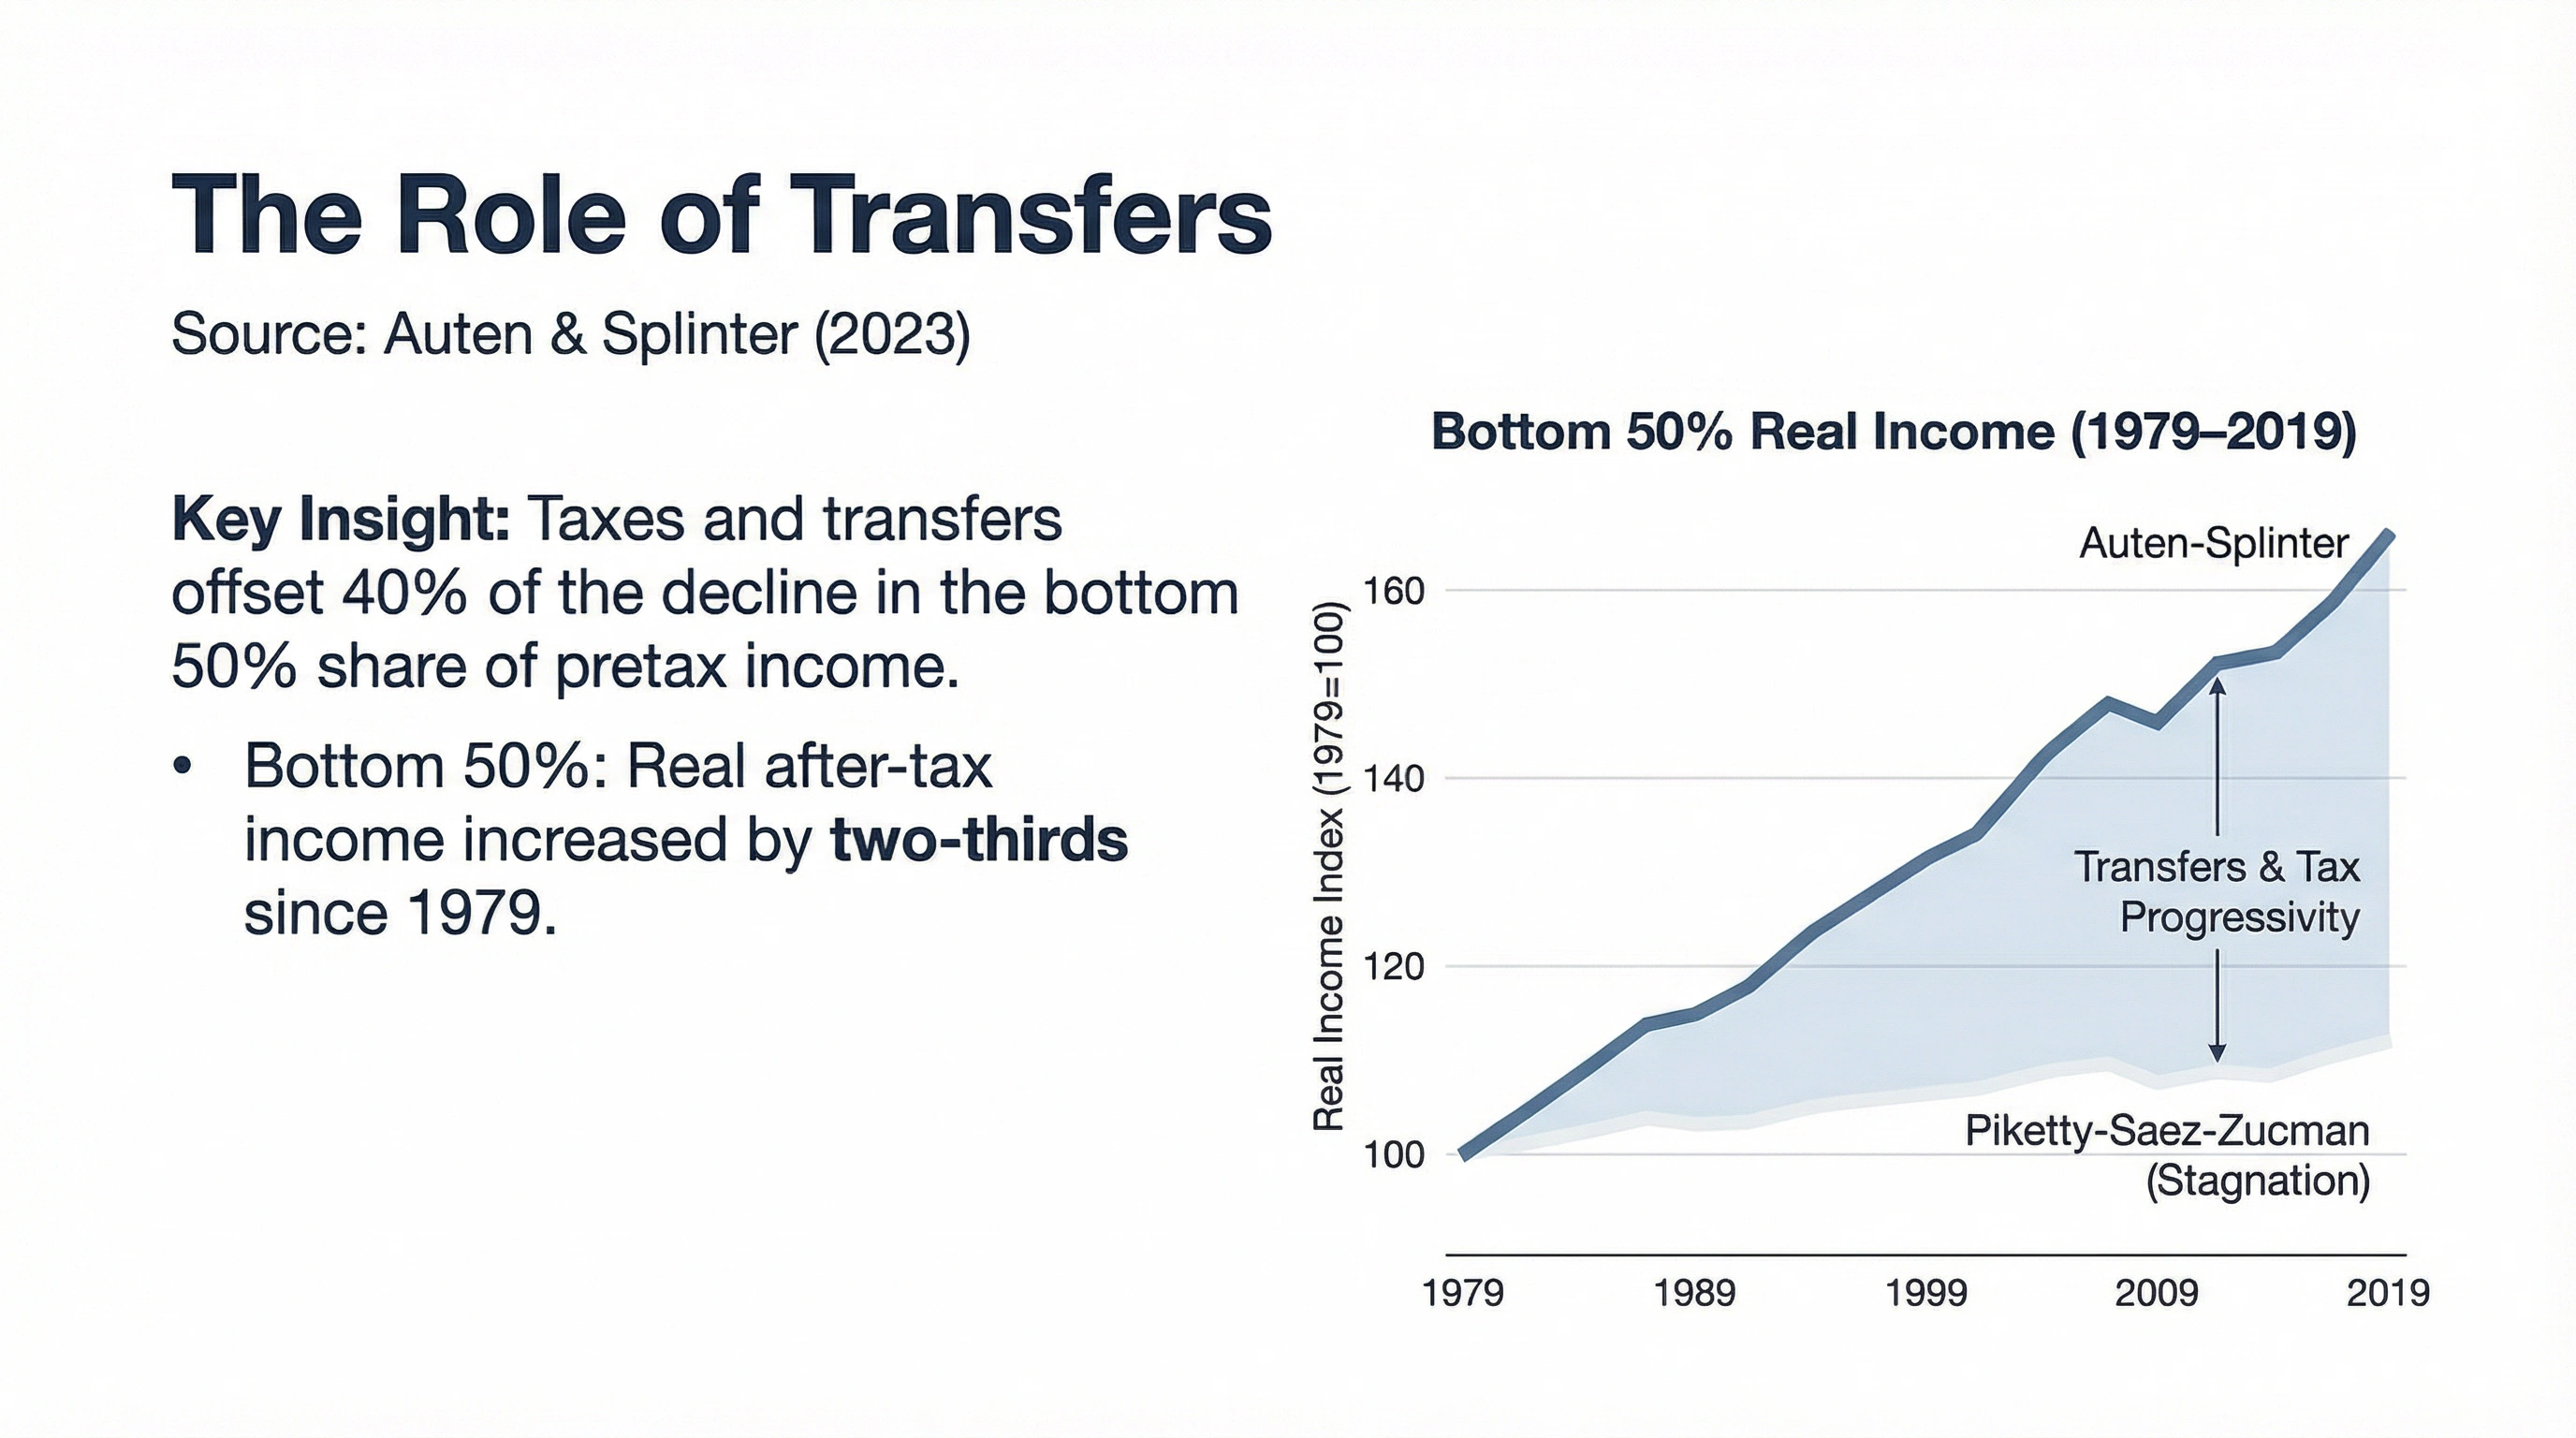
The Role of Transfers
Taxes and transfers offset 40% of pretax decline
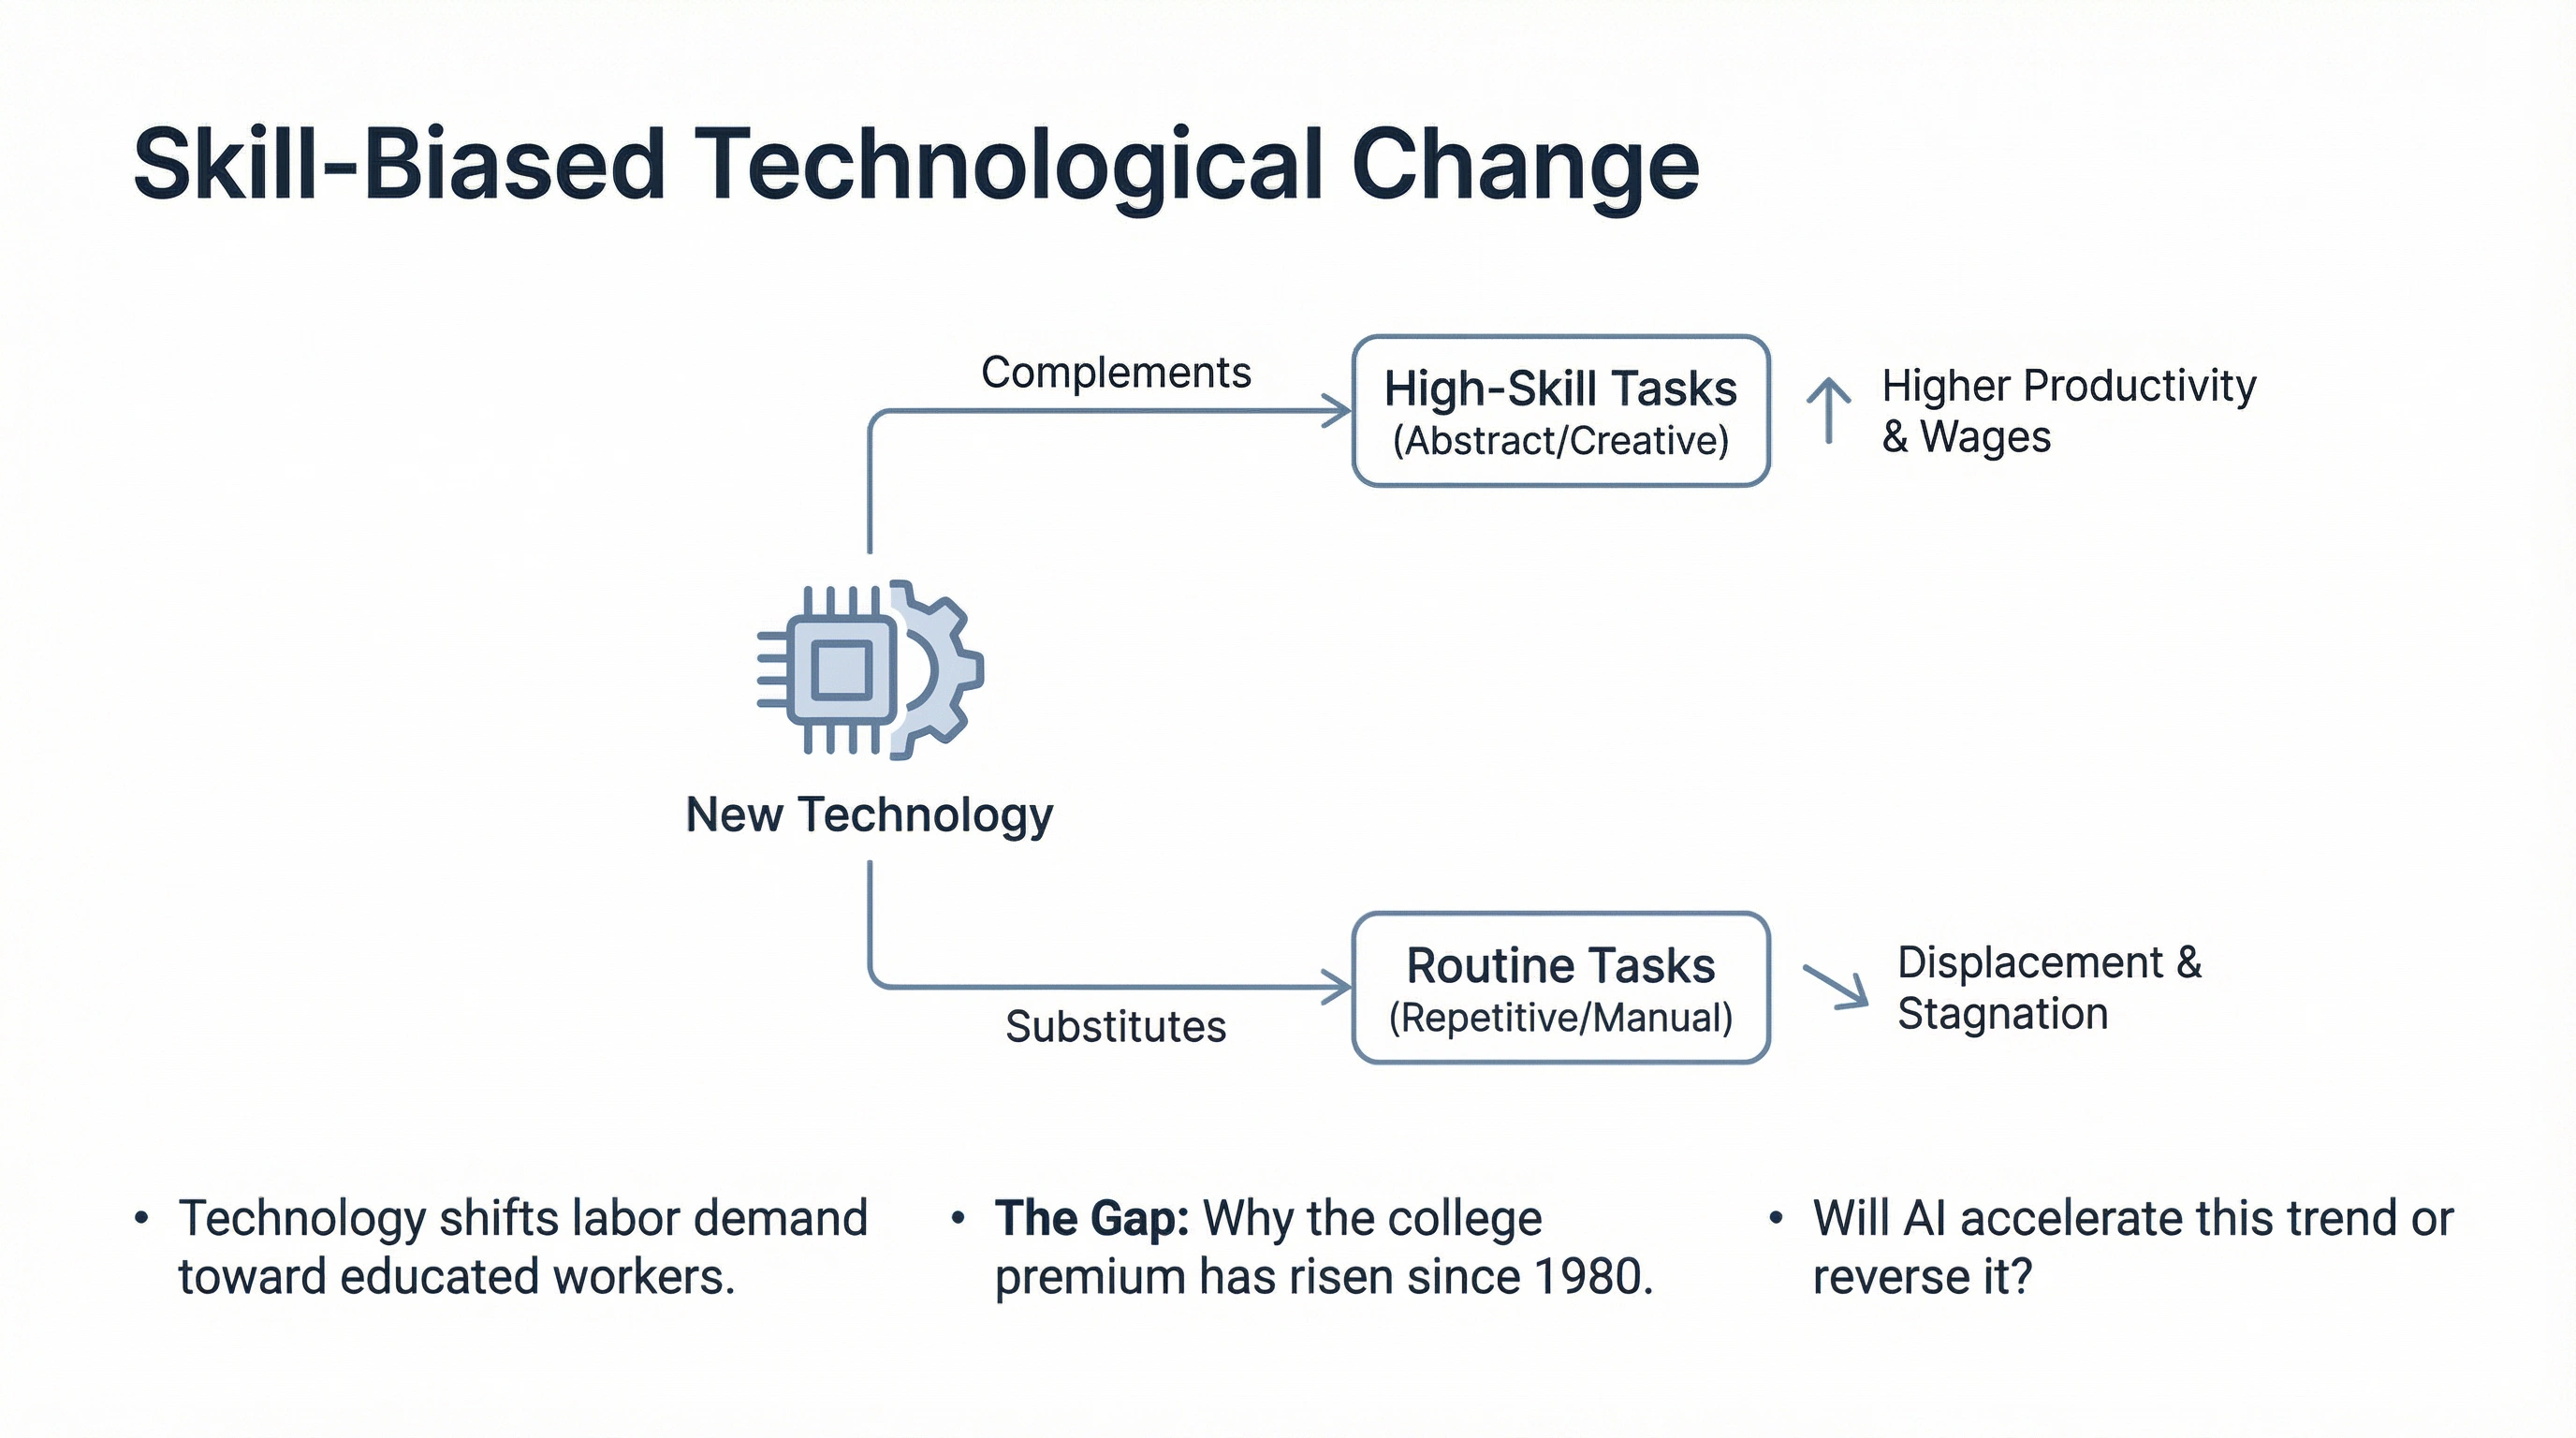
Skill-Biased Change
Technology and the wage gap
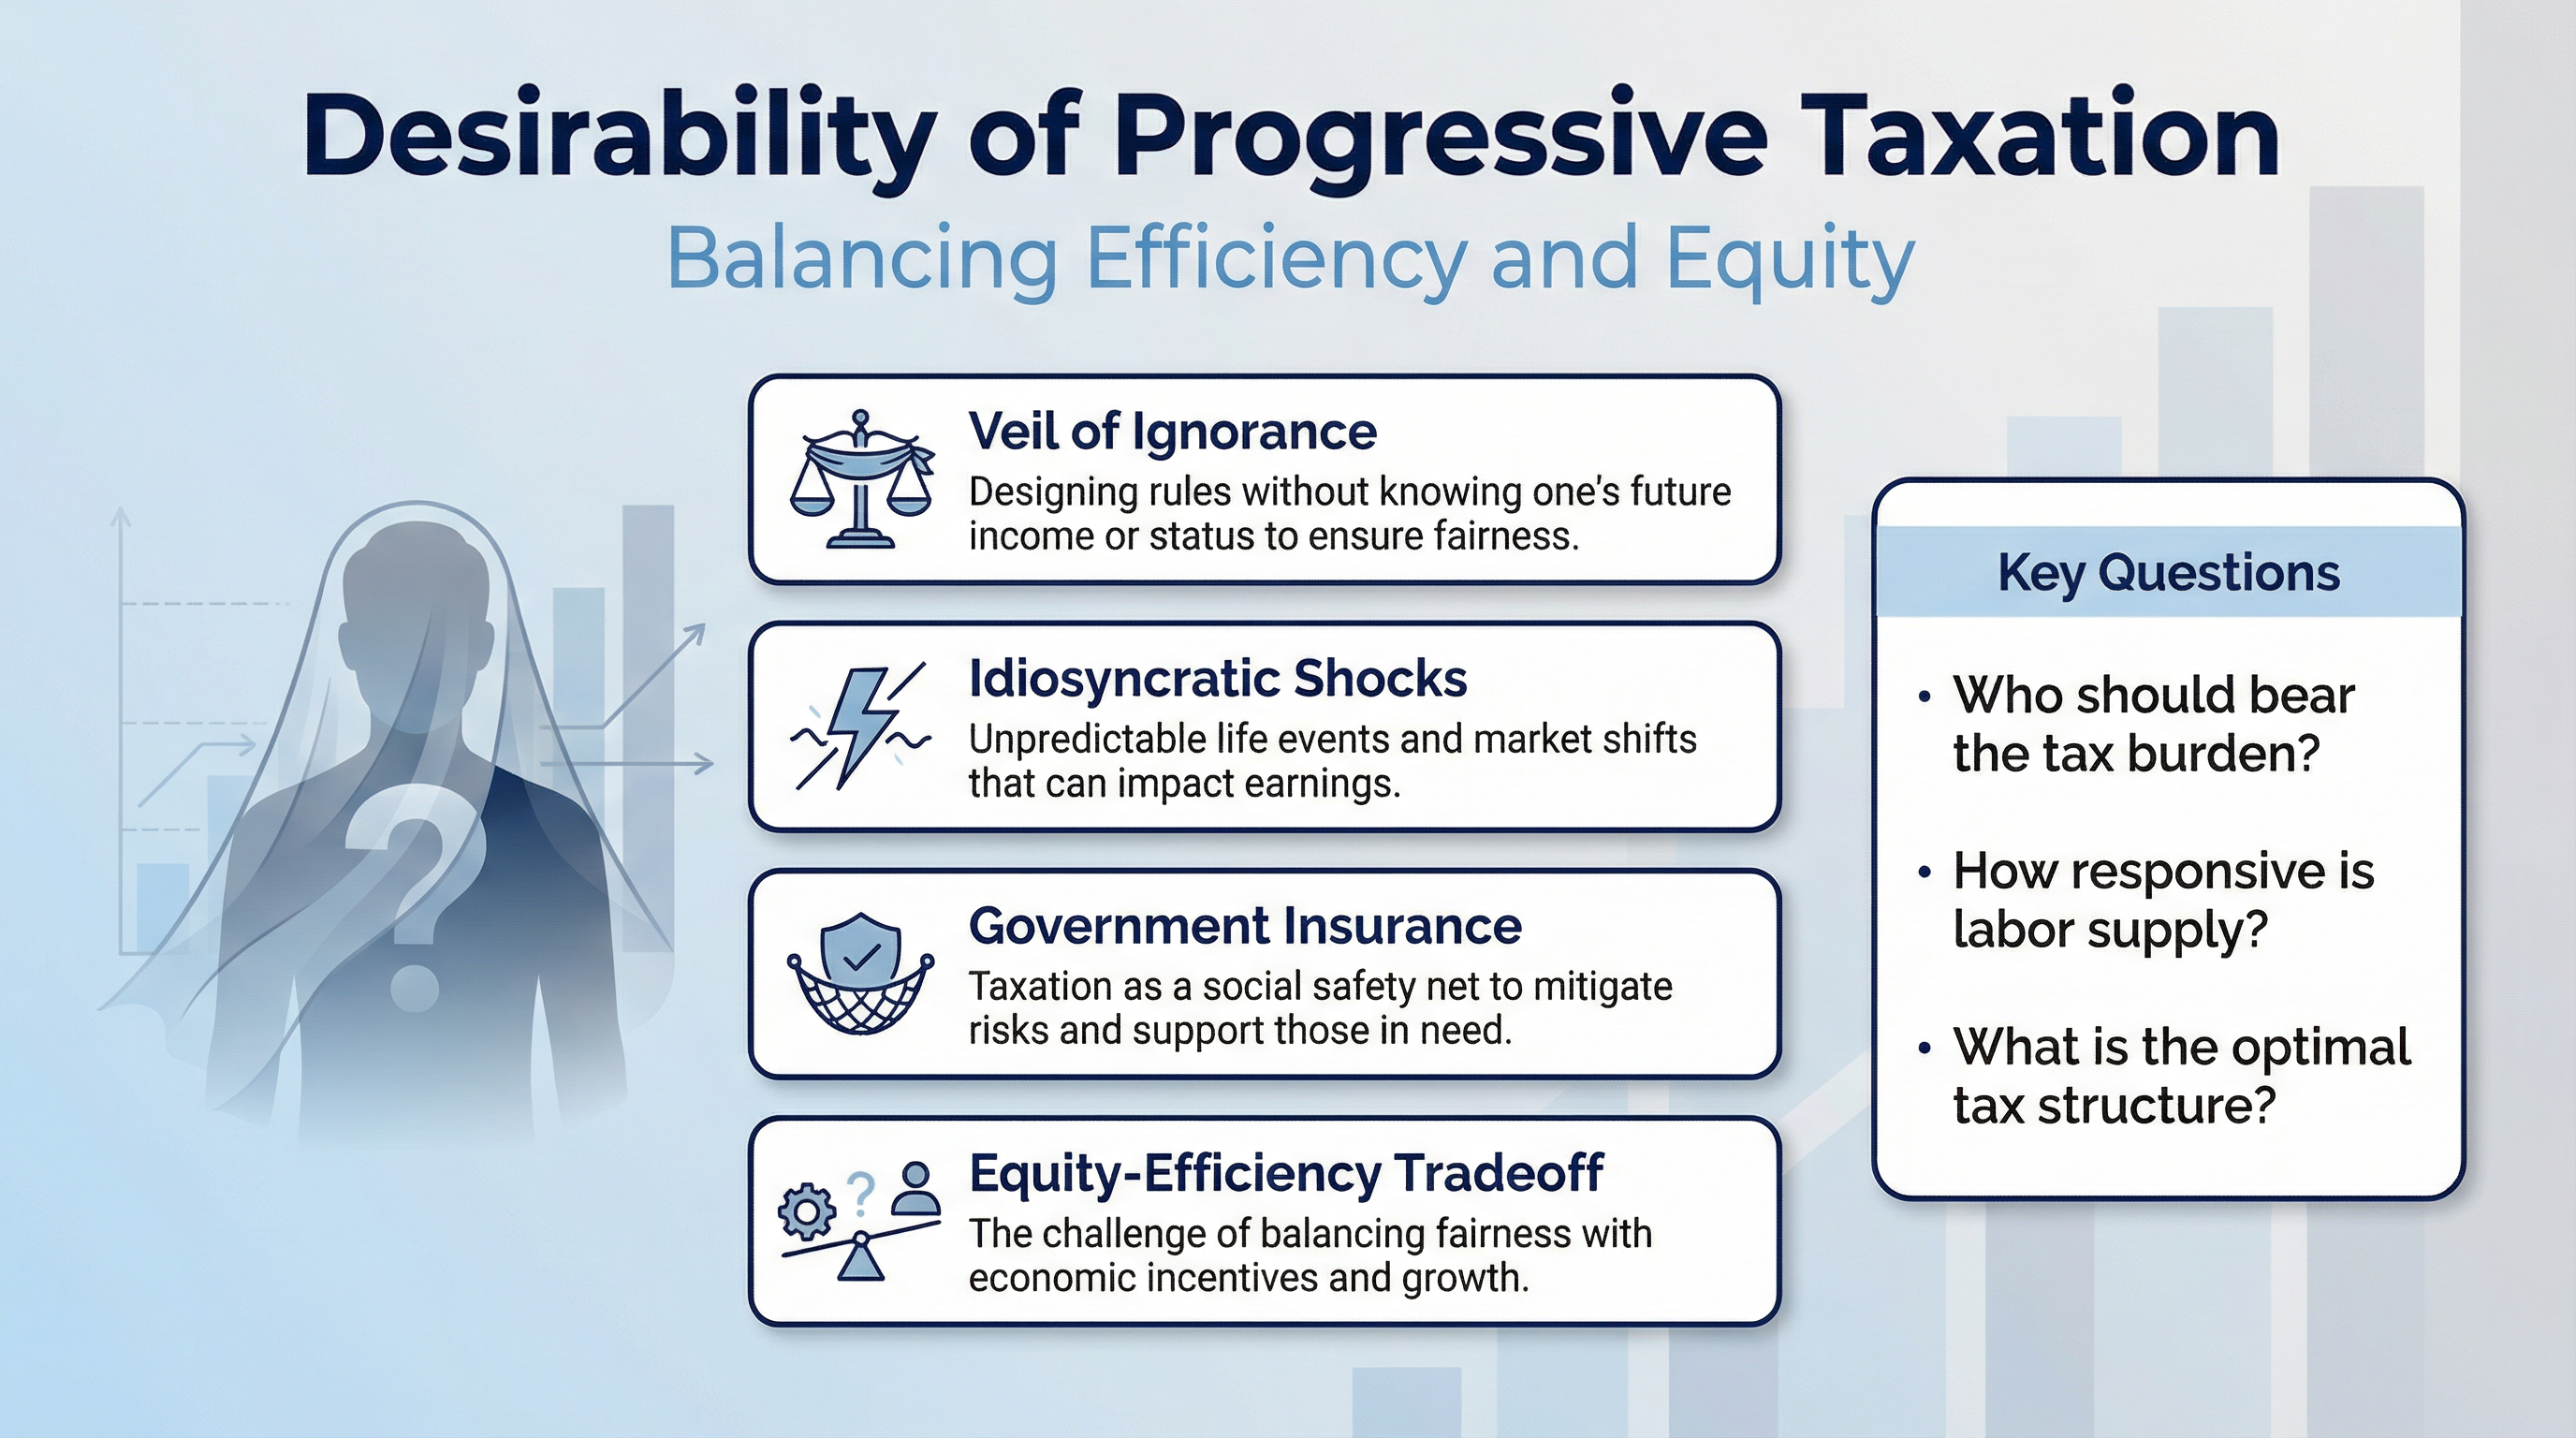
Desirability of Progressive Taxation
Balancing efficiency and equity
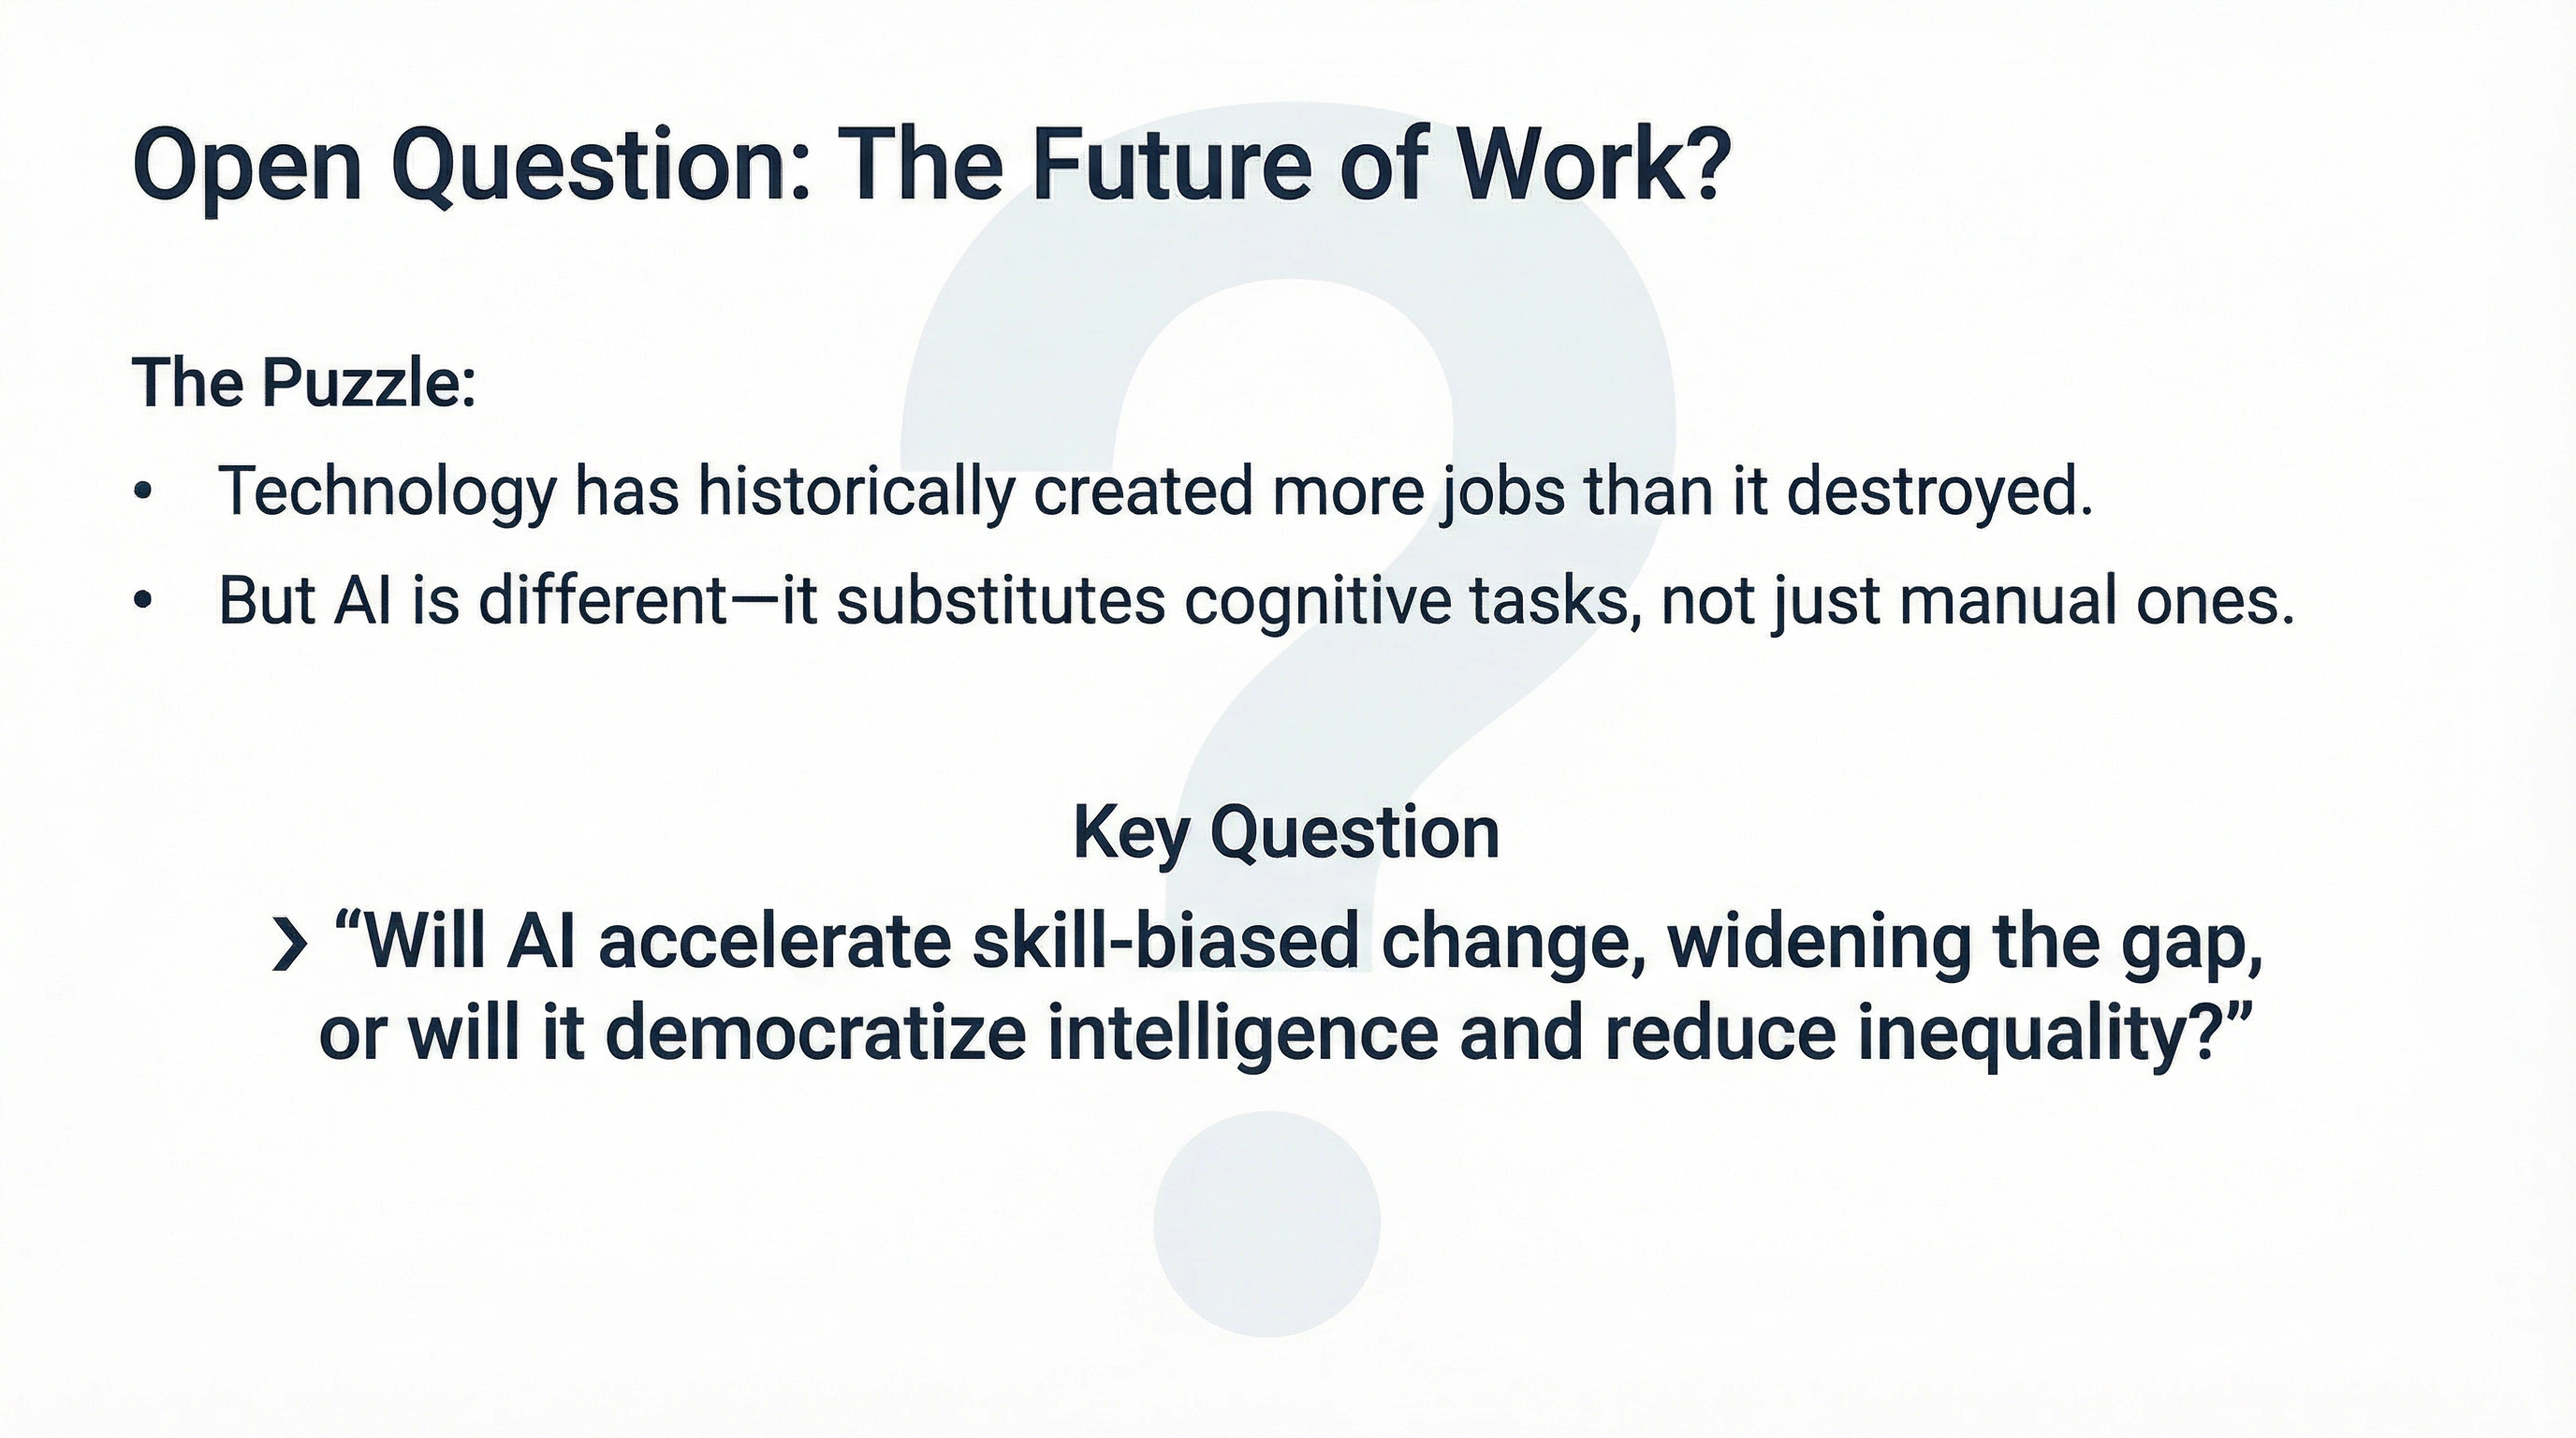
Open Question: Future of Work?
Will AI accelerate inequality?
Part V: Public Finance
Debt, Taxes, and Efficiency
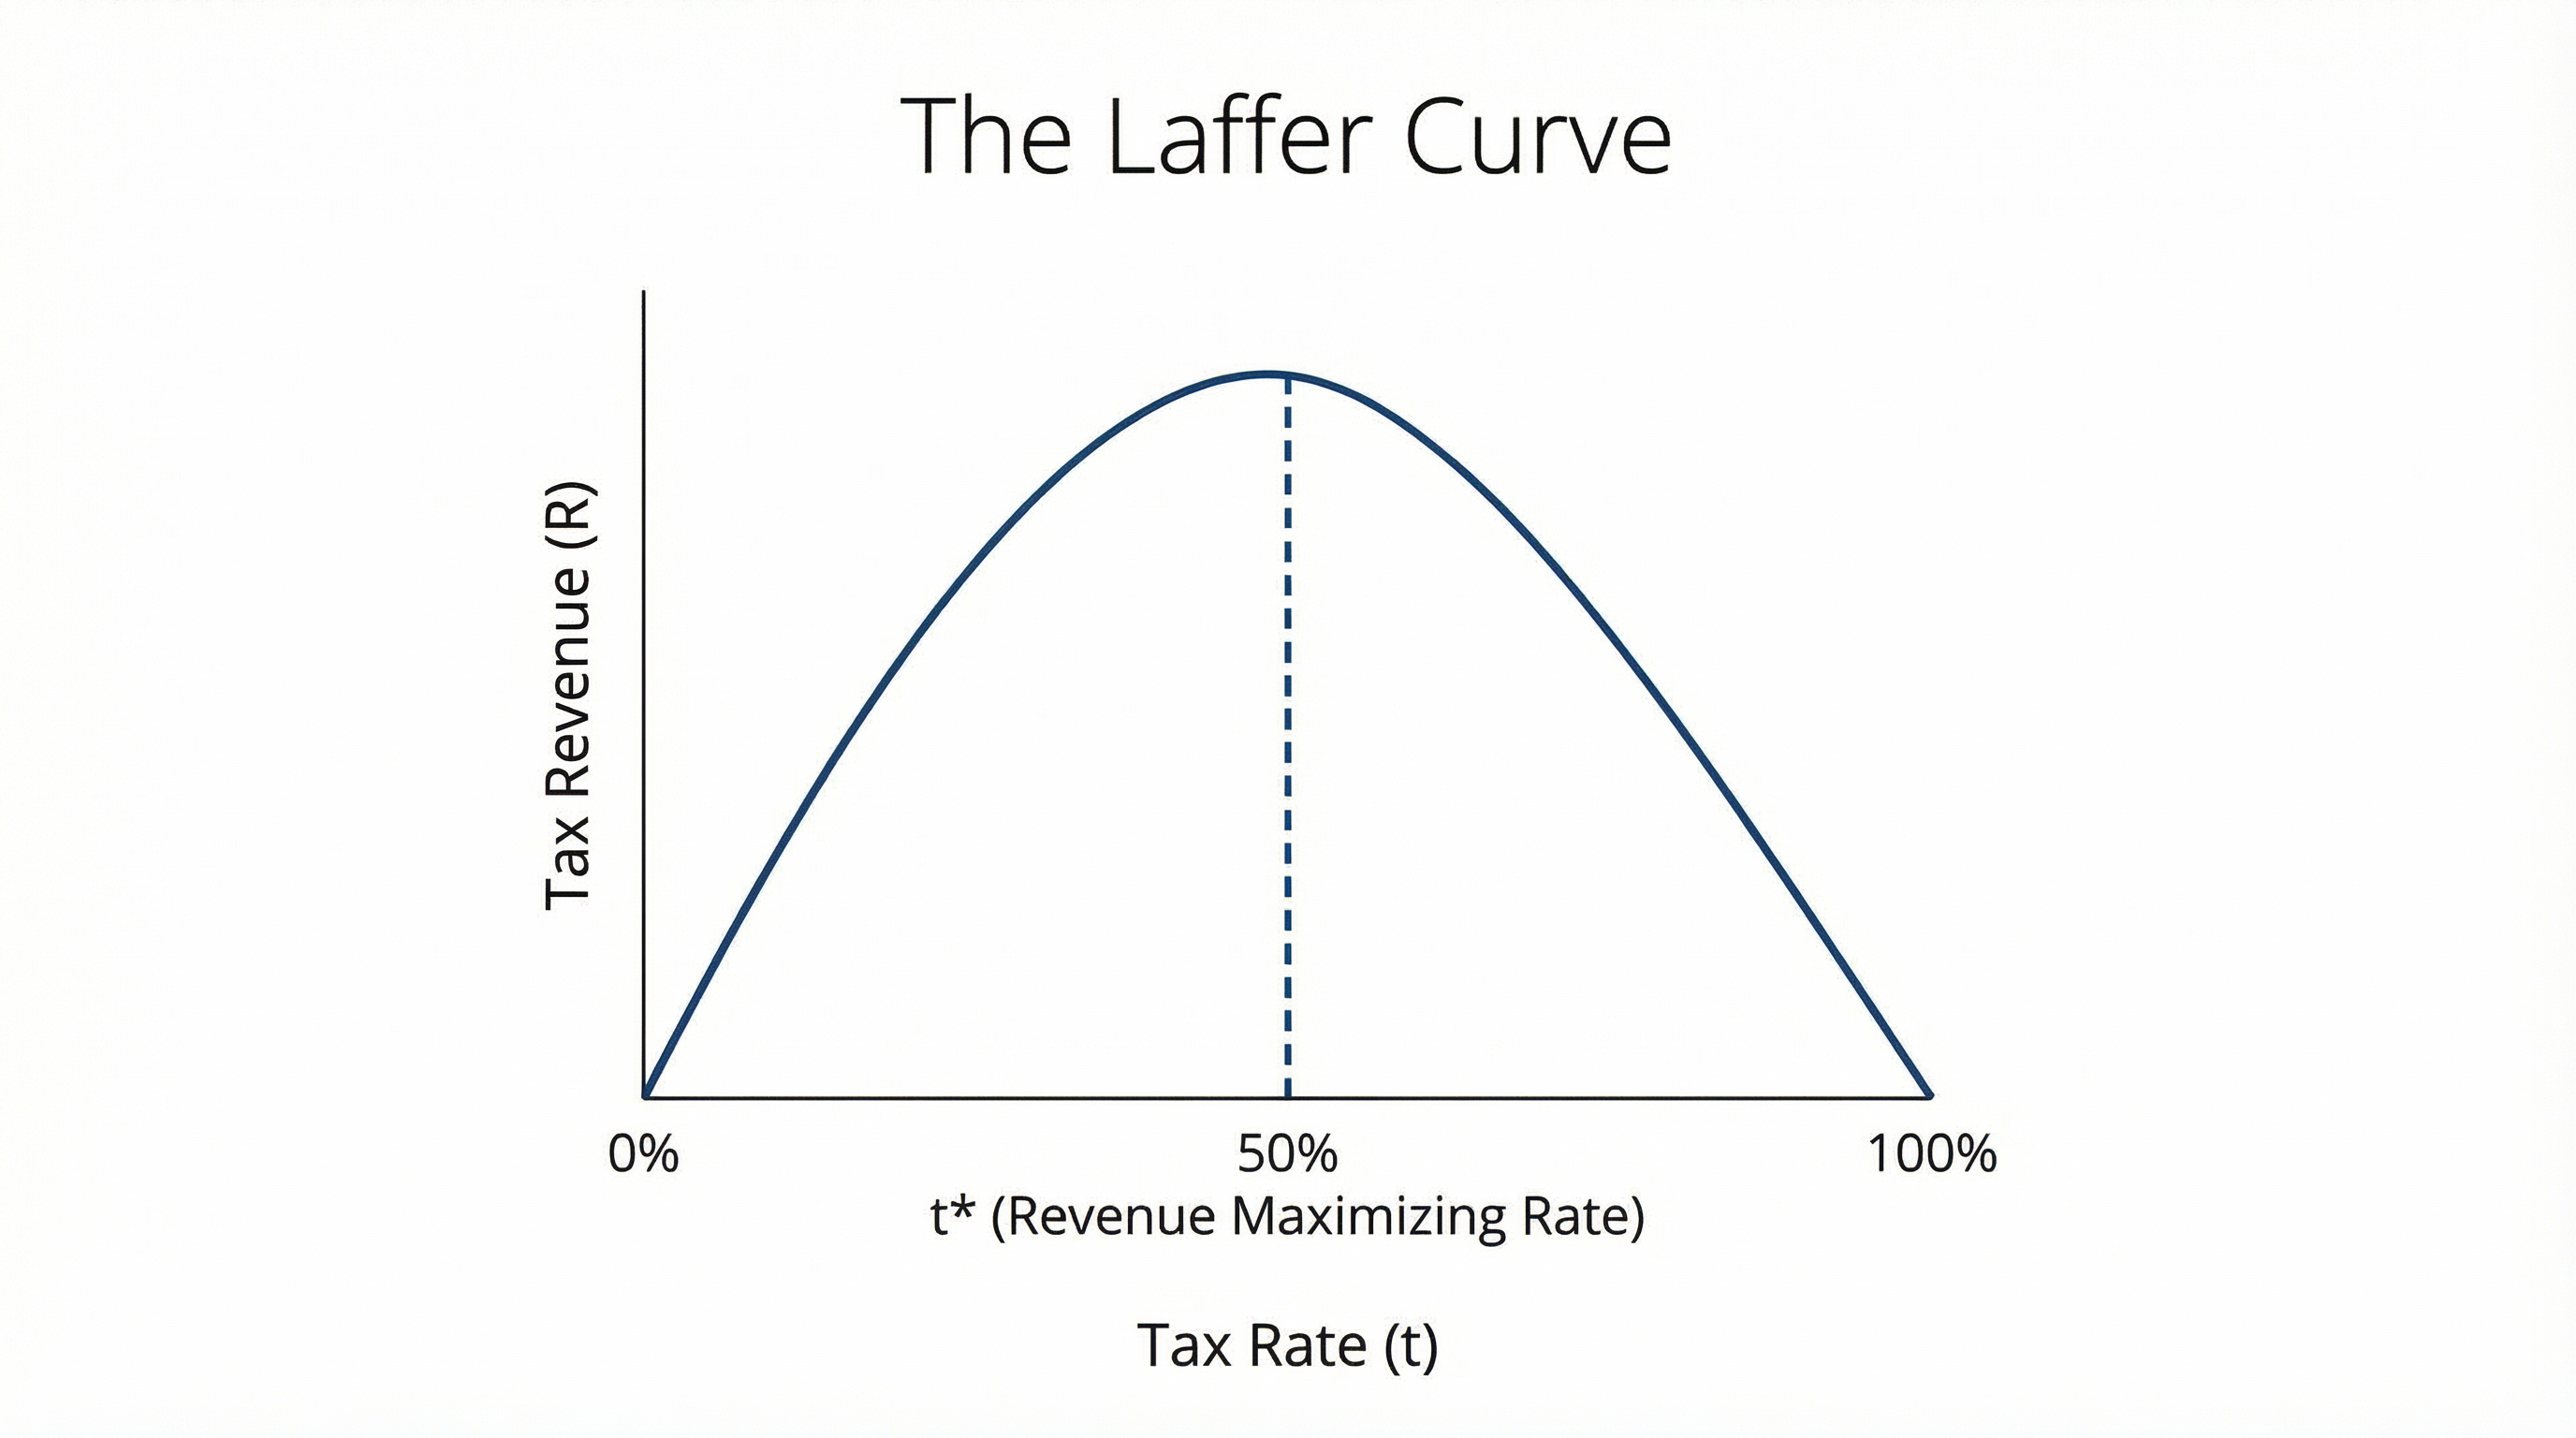
The Laffer Curve
Theoretical Limits of Taxation
Laffer Curve in Reality
Where are we now?
The curve implies a revenue-maximizing tax rate (t*).
Most empirical estimates suggest US rates are well to the left of t*.
Cutting taxes rarely pays for itself (e.g., 2017 Tax Cuts).
Exception: Very high marginal rates (e.g., >70%) may dampen revenue.
The VAT Puzzle
Feature or Bug?
Most developed countries rely heavily on Value Added Tax (VAT) for revenue.
The United States is a notable outlier: No federal VAT.
Is this a feature of our system or a bug?
How does this choice impact efficiency and revenue capacity?
The Revenue Challenge
Modern State in an Open Economy
Big Question: How can a modern state raise substantial revenue...
...in a globalized, open economy...
...without undermining productive efficiency?
We need a tax system that minimizes distortions to production decisions.
Diamond-Mirrlees Theorem
Production Efficiency (1971)
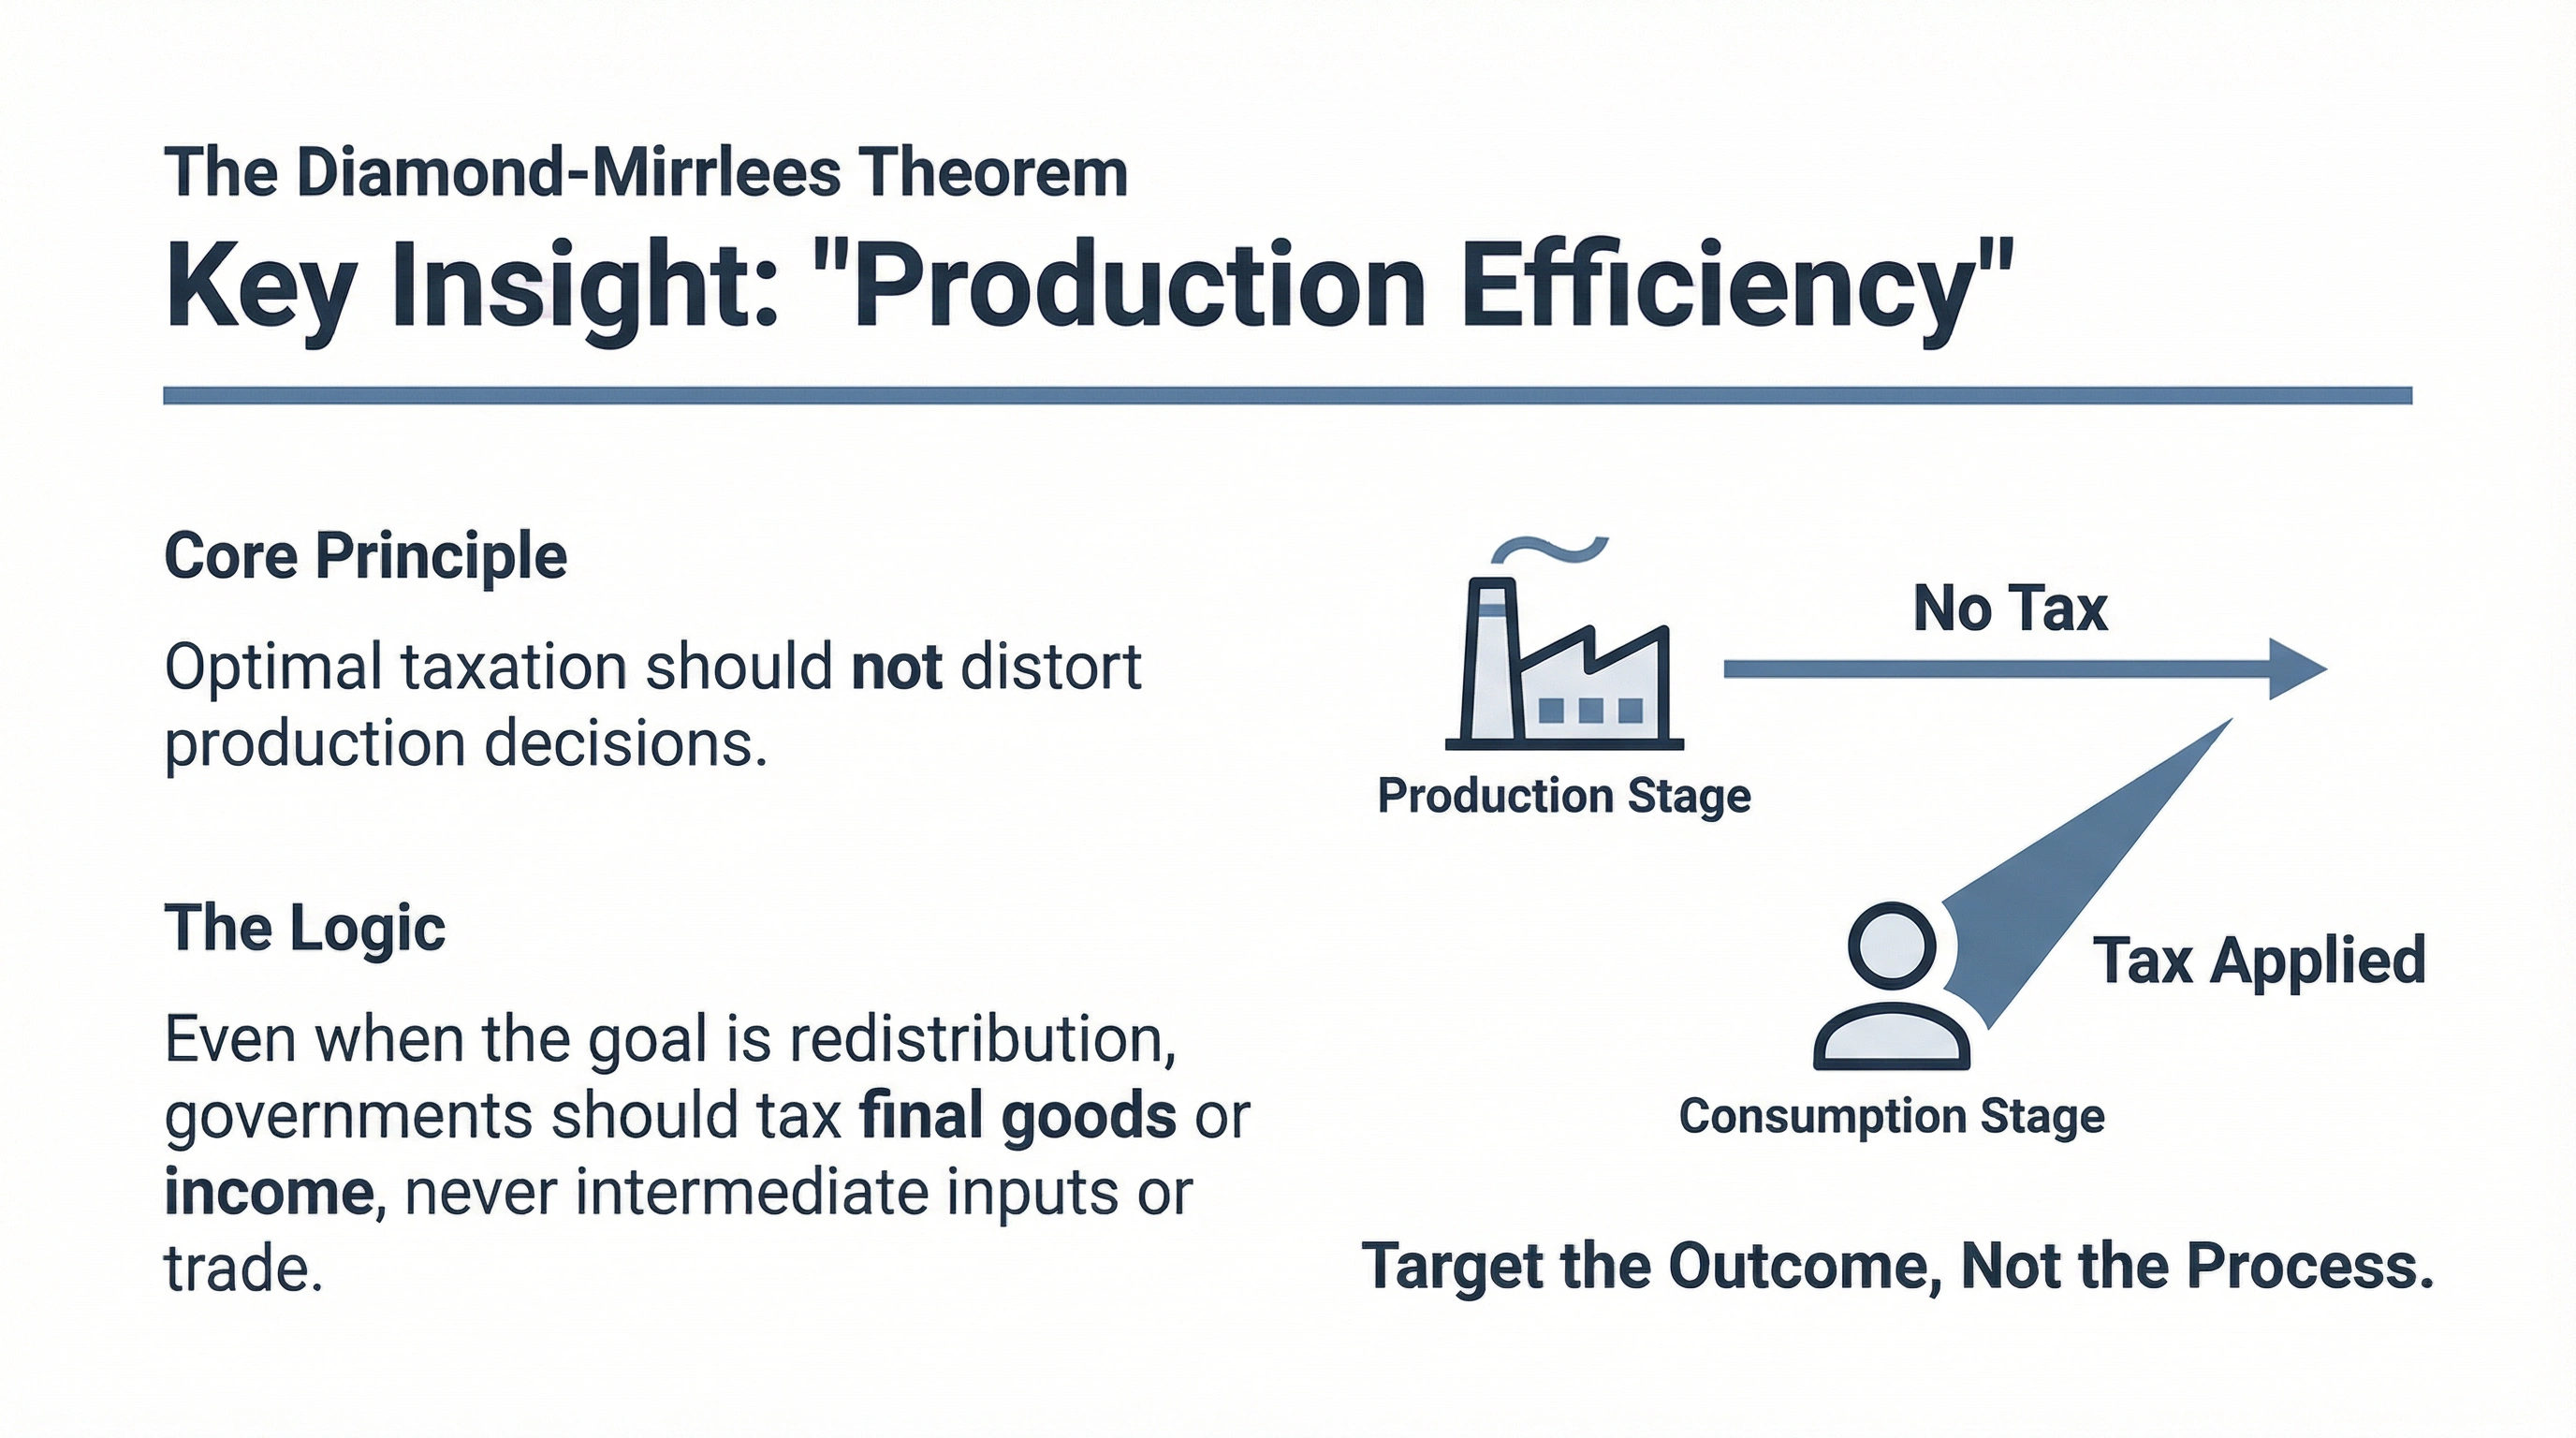
Policy Implications
What Diamond-Mirrlees Tells Us
Superiority of VAT: Taxes consumption without distorting intermediate production steps.
Desirability of Free Trade: Tariffs distort production efficiency; free trade is optimal.
No Taxation of Capital Income: Capital taxes distort intertemporal production choices.
Conclusion: Tax final consumption, not production inputs.
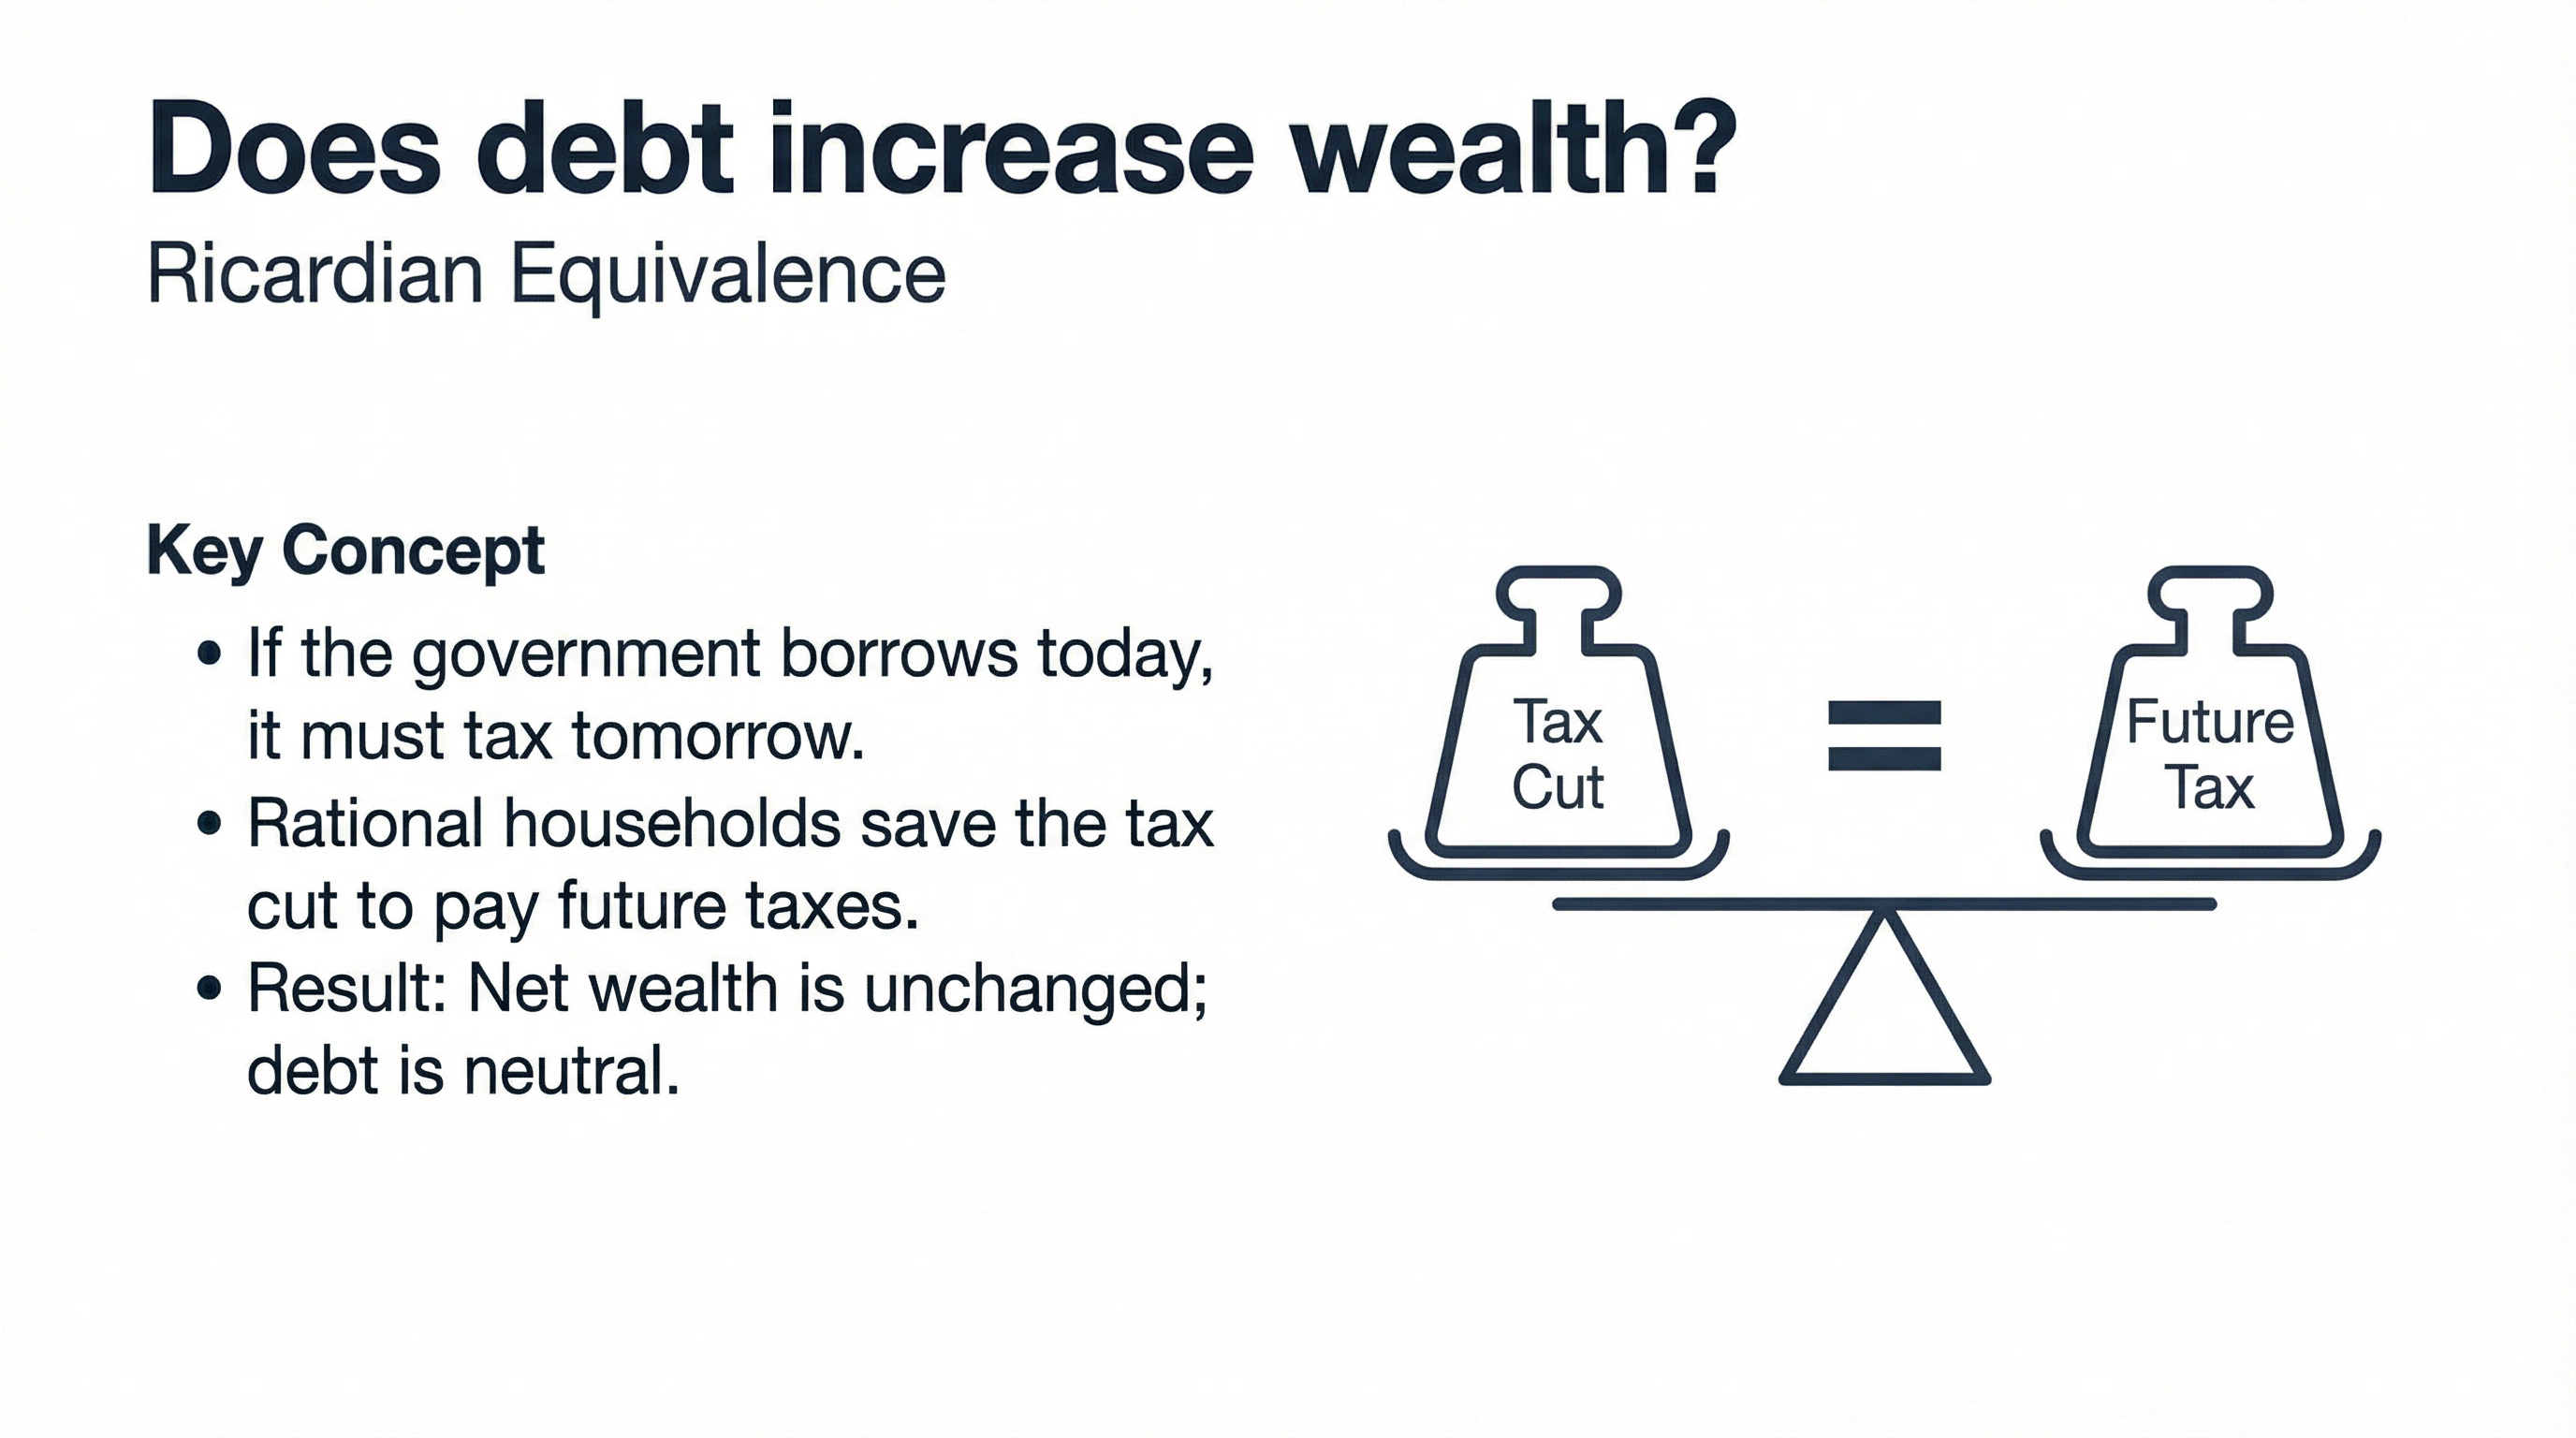
Does debt increase wealth?
Ricardian Equivalence
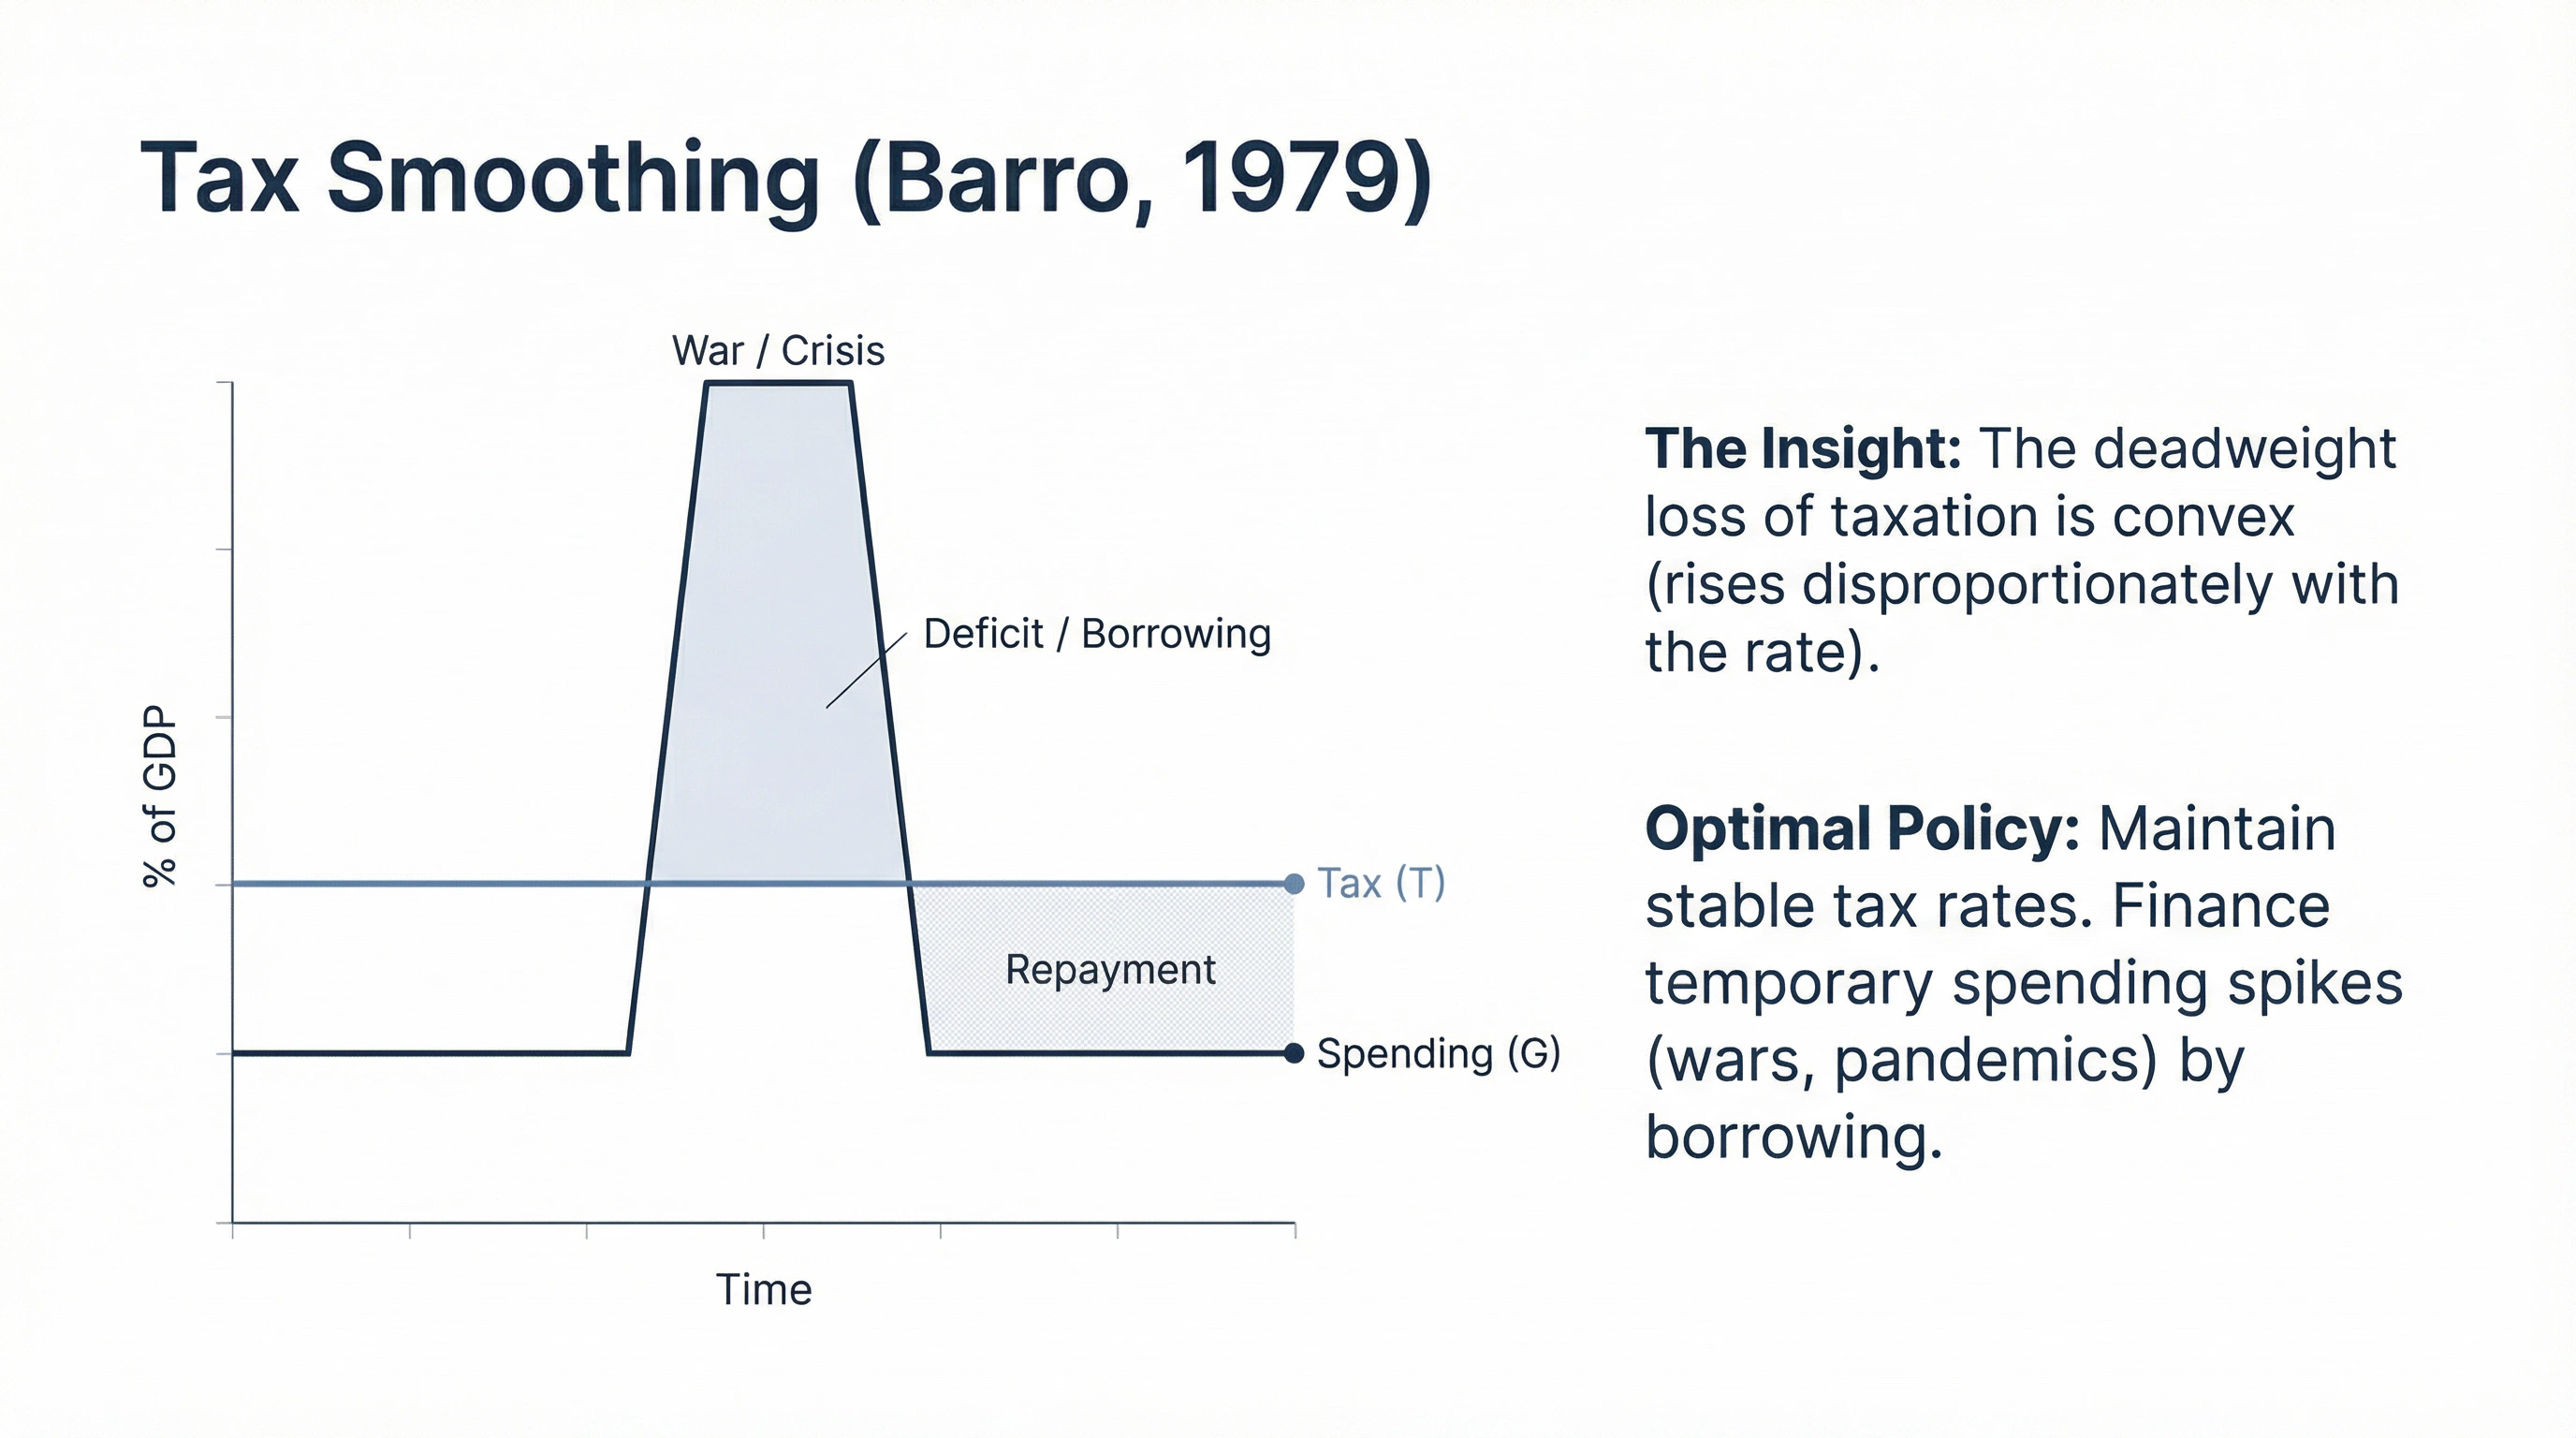
How to pay for wars?
Tax Smoothing and Deficits
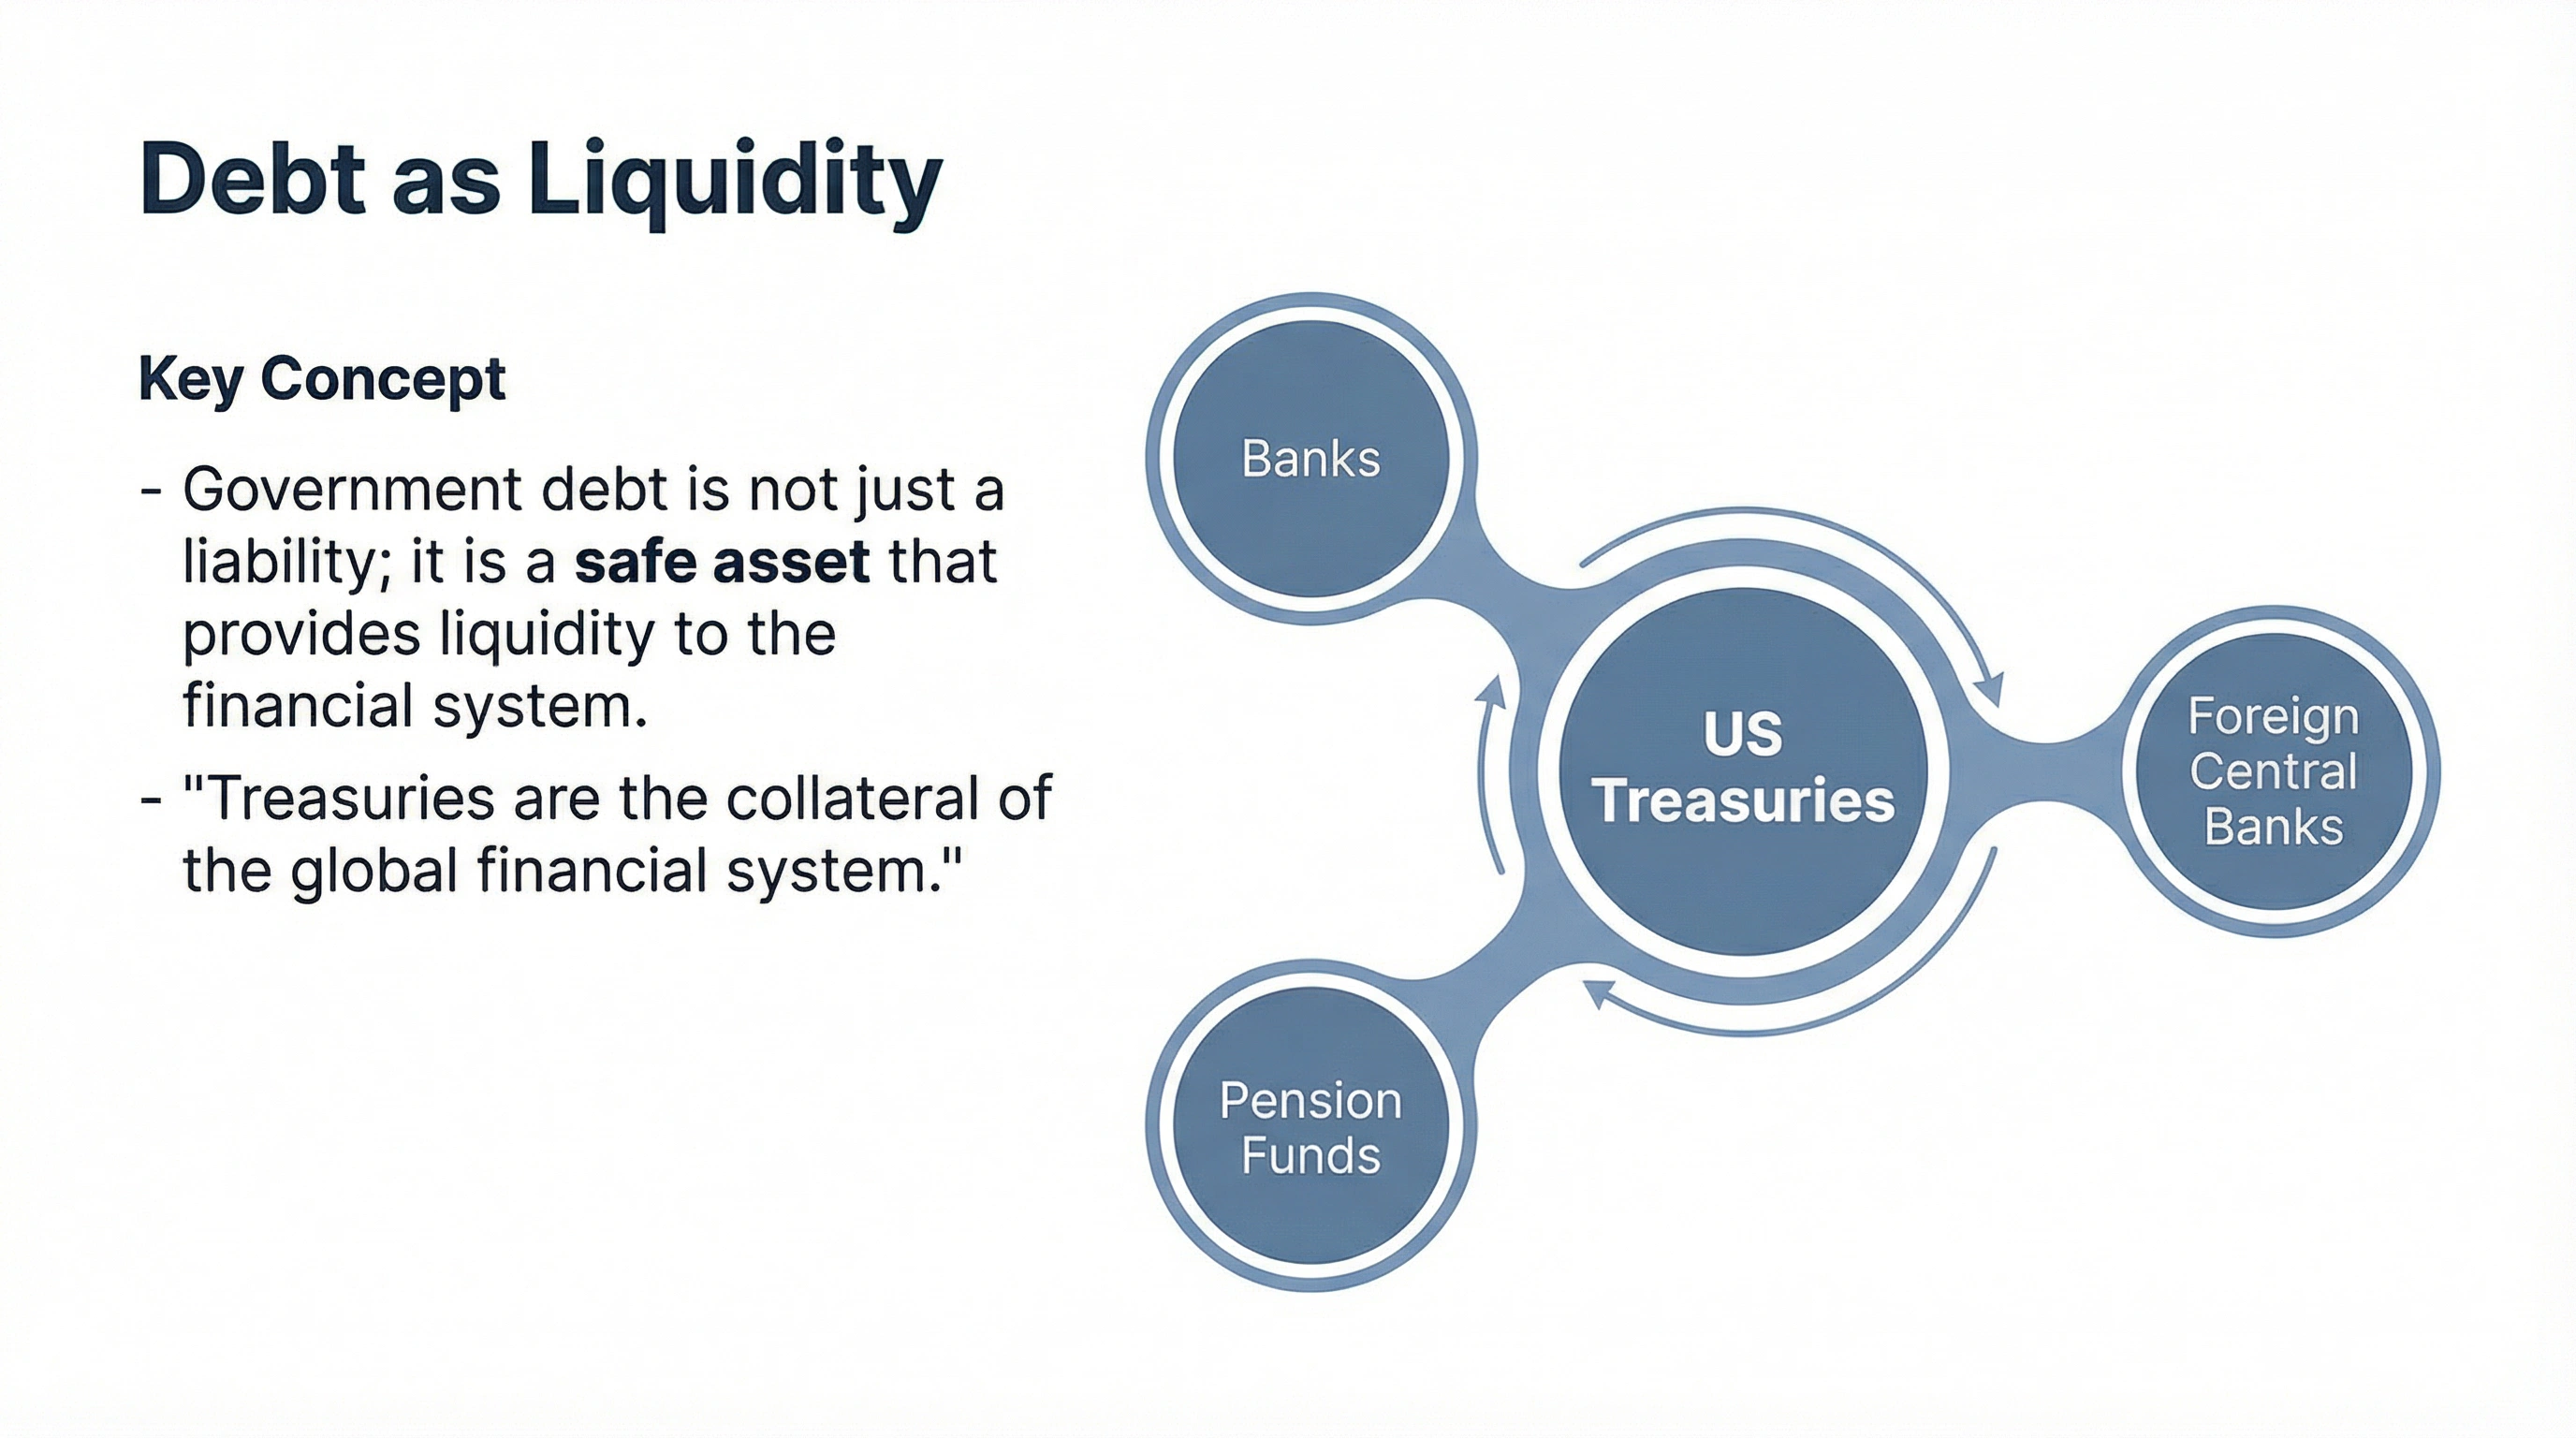
Debt as Liquidity
Treasuries as the global safe asset
The Looming Fiscal Crisis
Rising Debt
"I used to think that if there was reincarnation, I wanted to come back as the president or the pope... But now I would like to come back as the bond market. You can intimidate everybody."
— James Carville, Clinton Political Adviser
Debt-to-GDP is expected to exceed 150% over the next decade.
The Social Security Trust Fund is projected to be depleted by the early 2030s.
What are we going to do? Raise taxes or cut spending?
Part VI: Stock Market
Valuation and Concentration

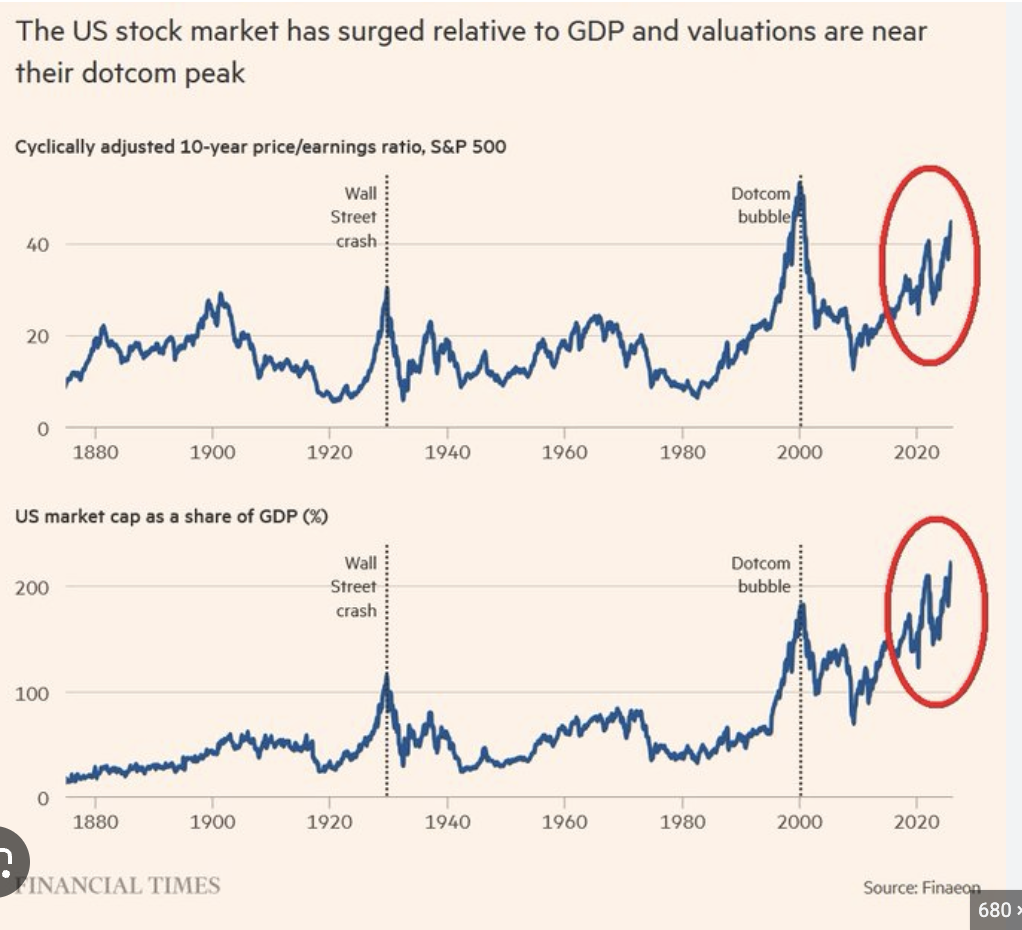
Market Valuation
Market Cap to GDP & CAPE Ratio
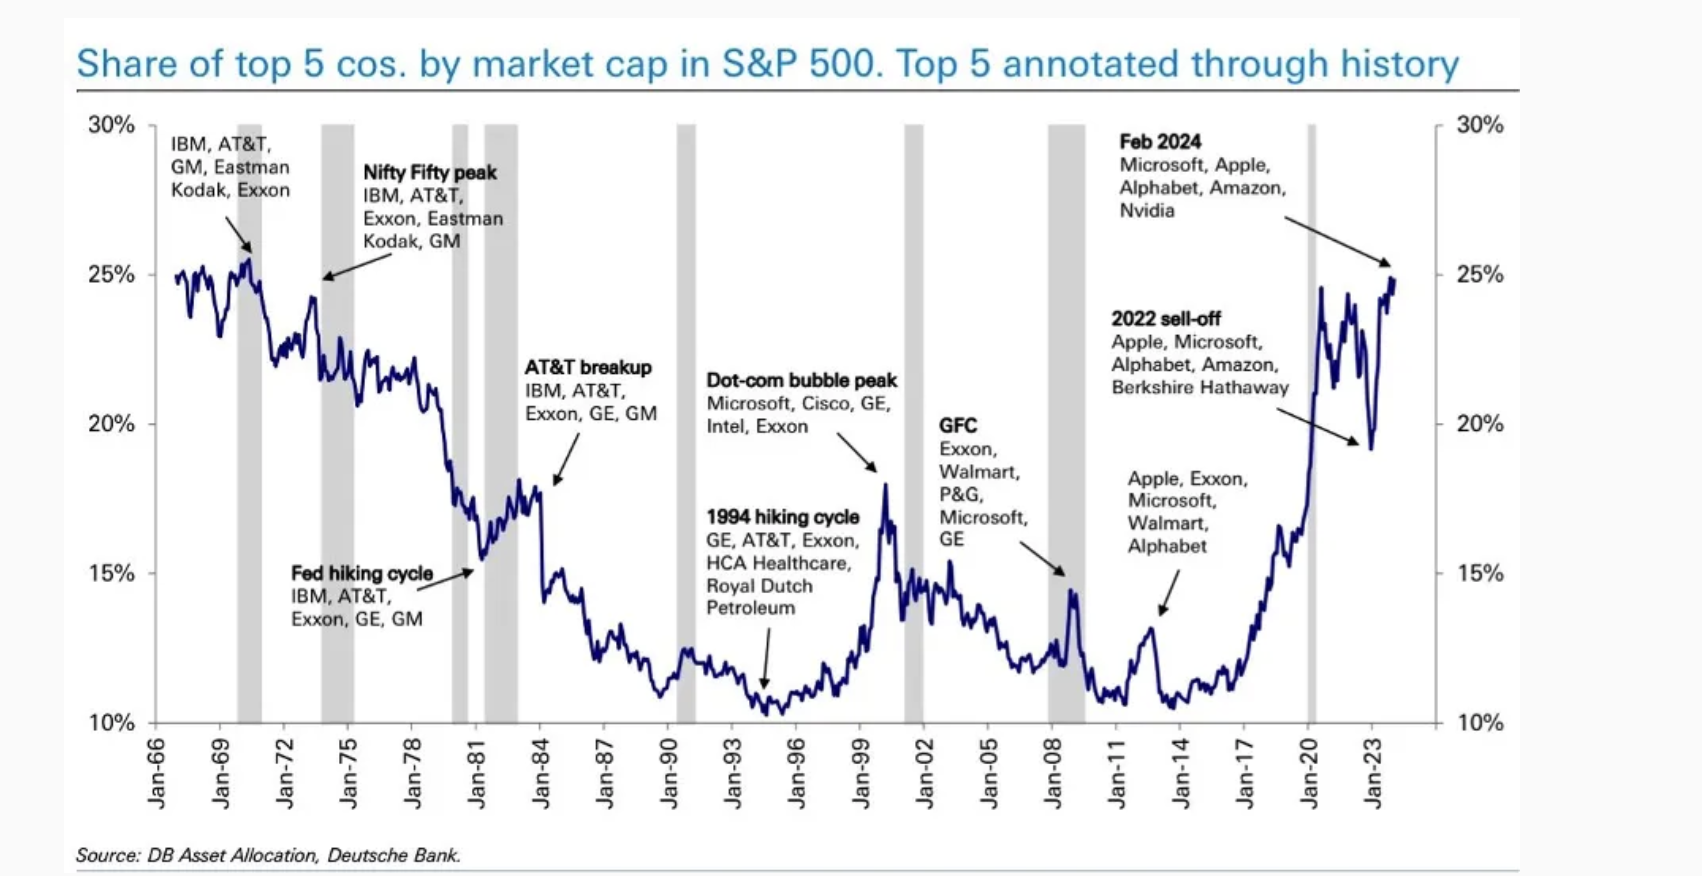
Market Concentration
Share of Top 5 Companies in S&P 500
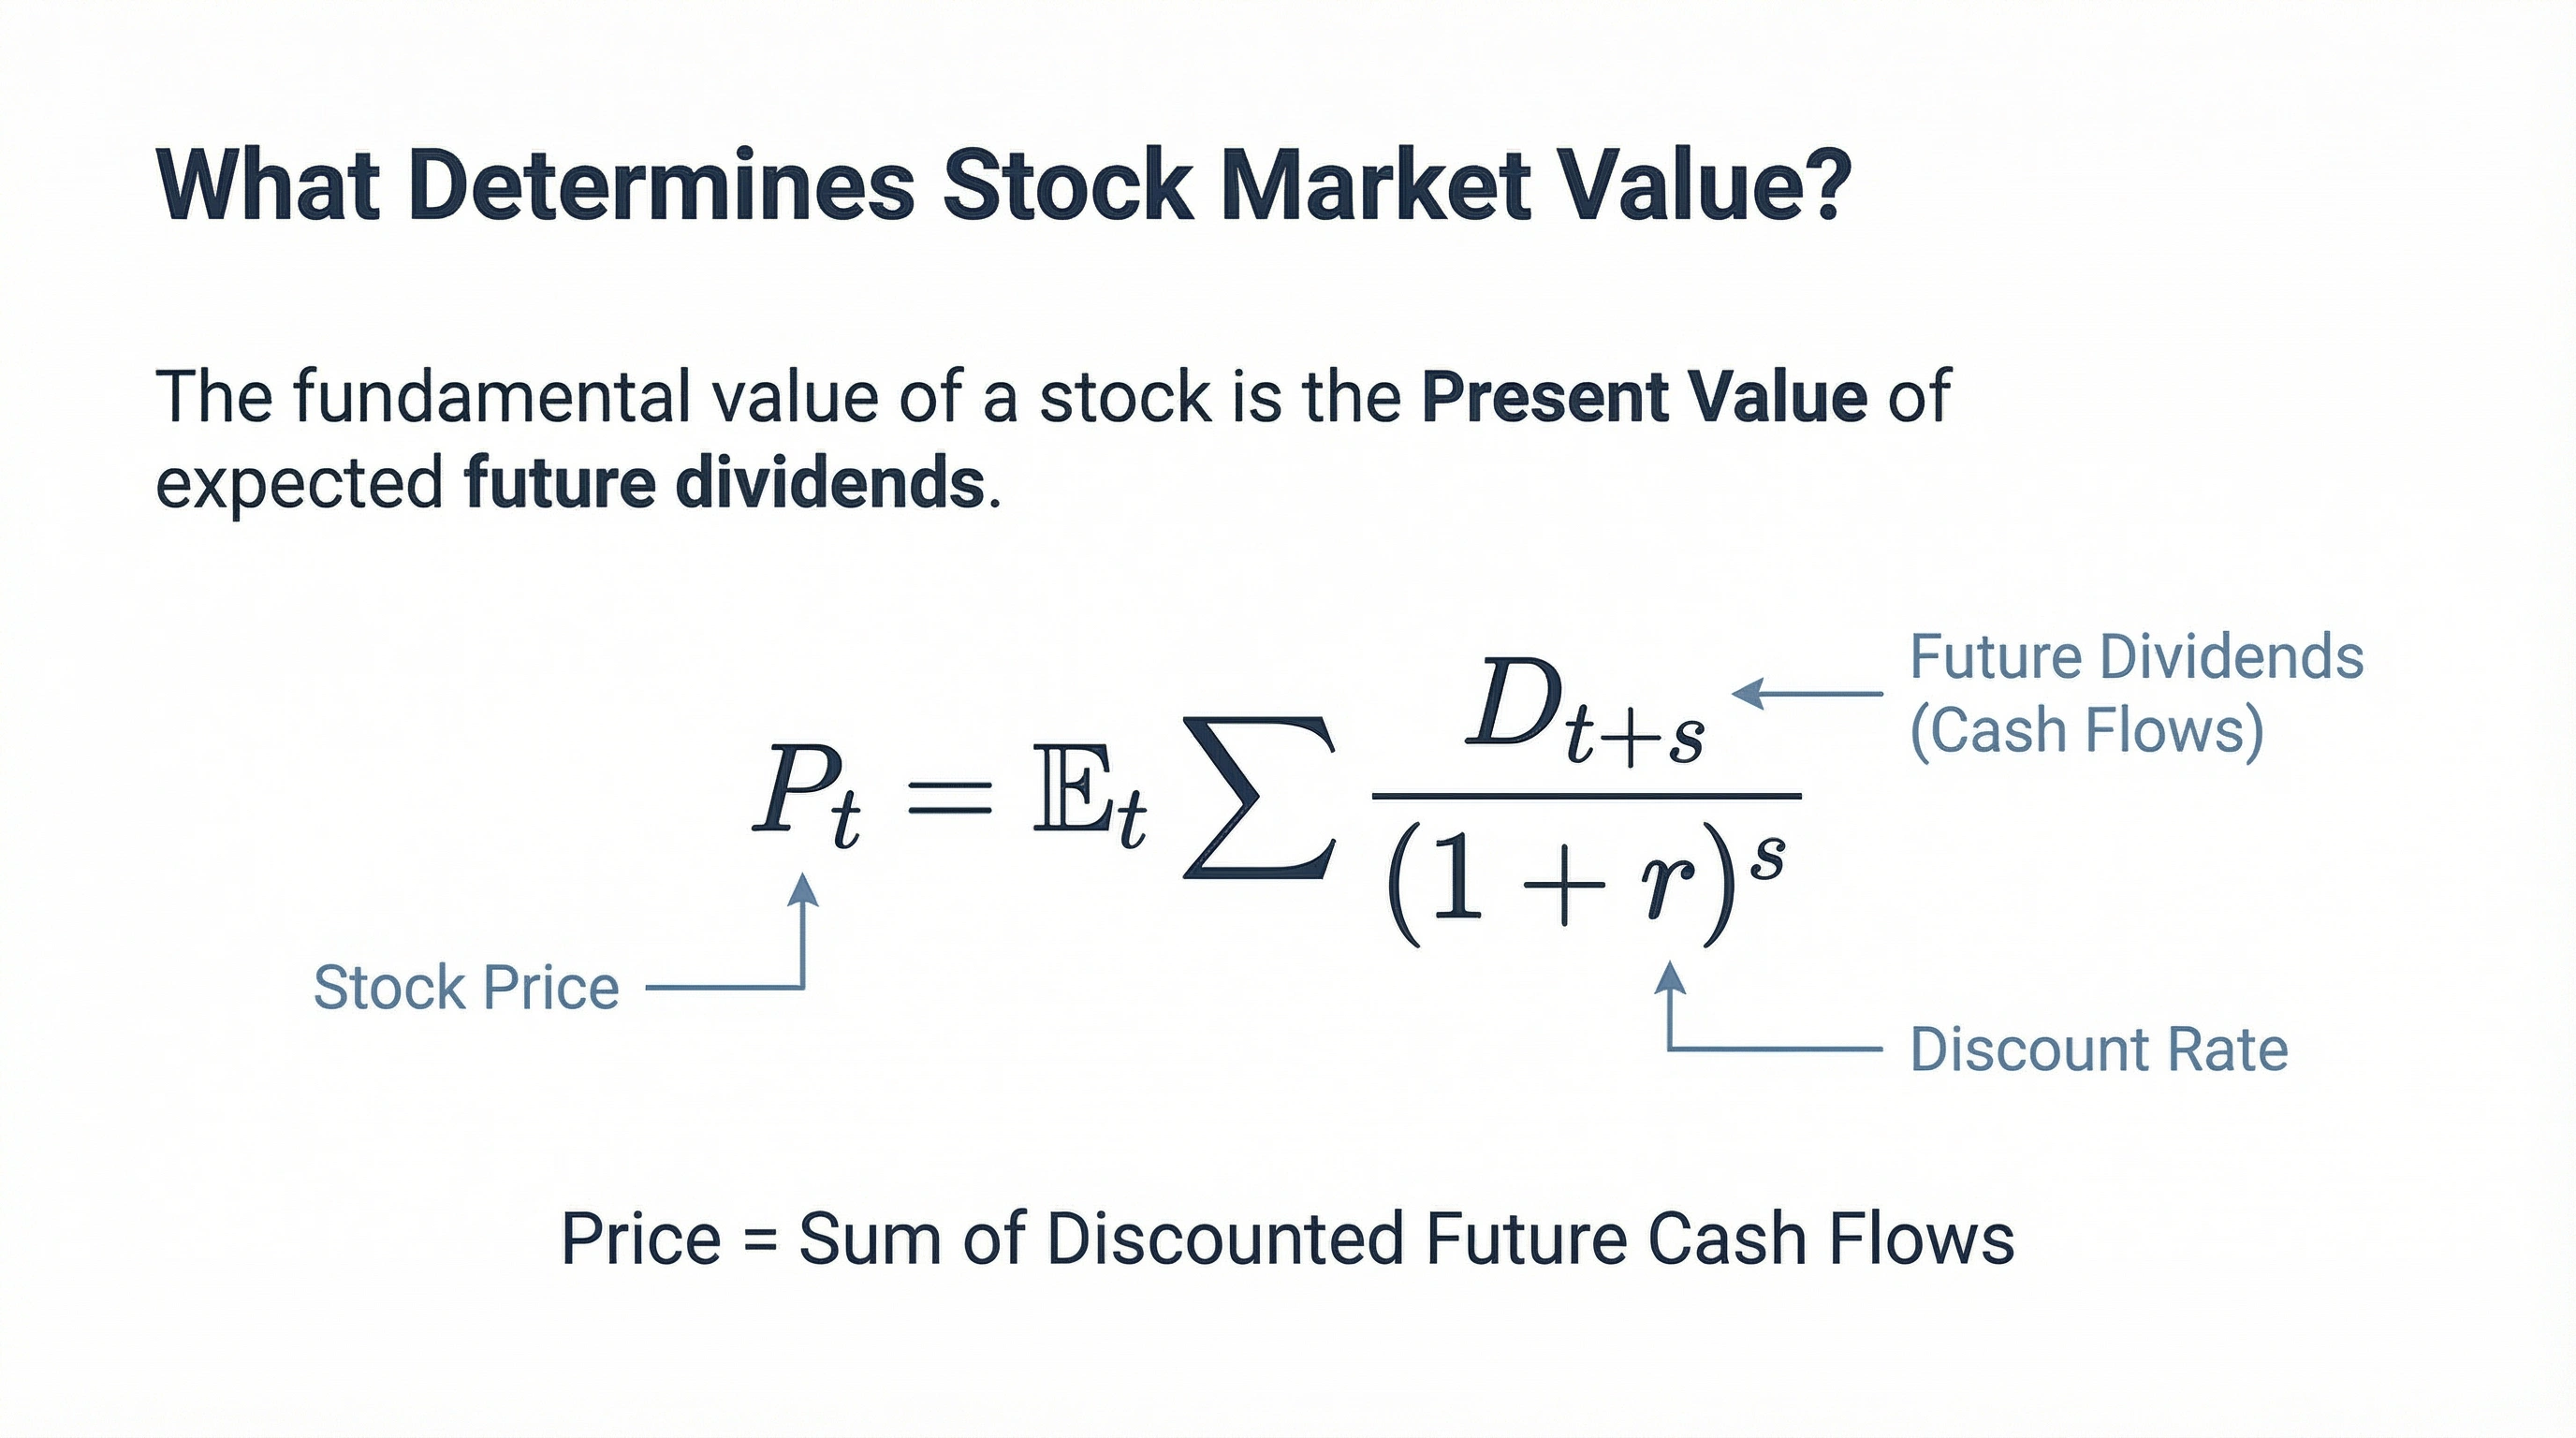
Stock Market Value
The Present Value Model
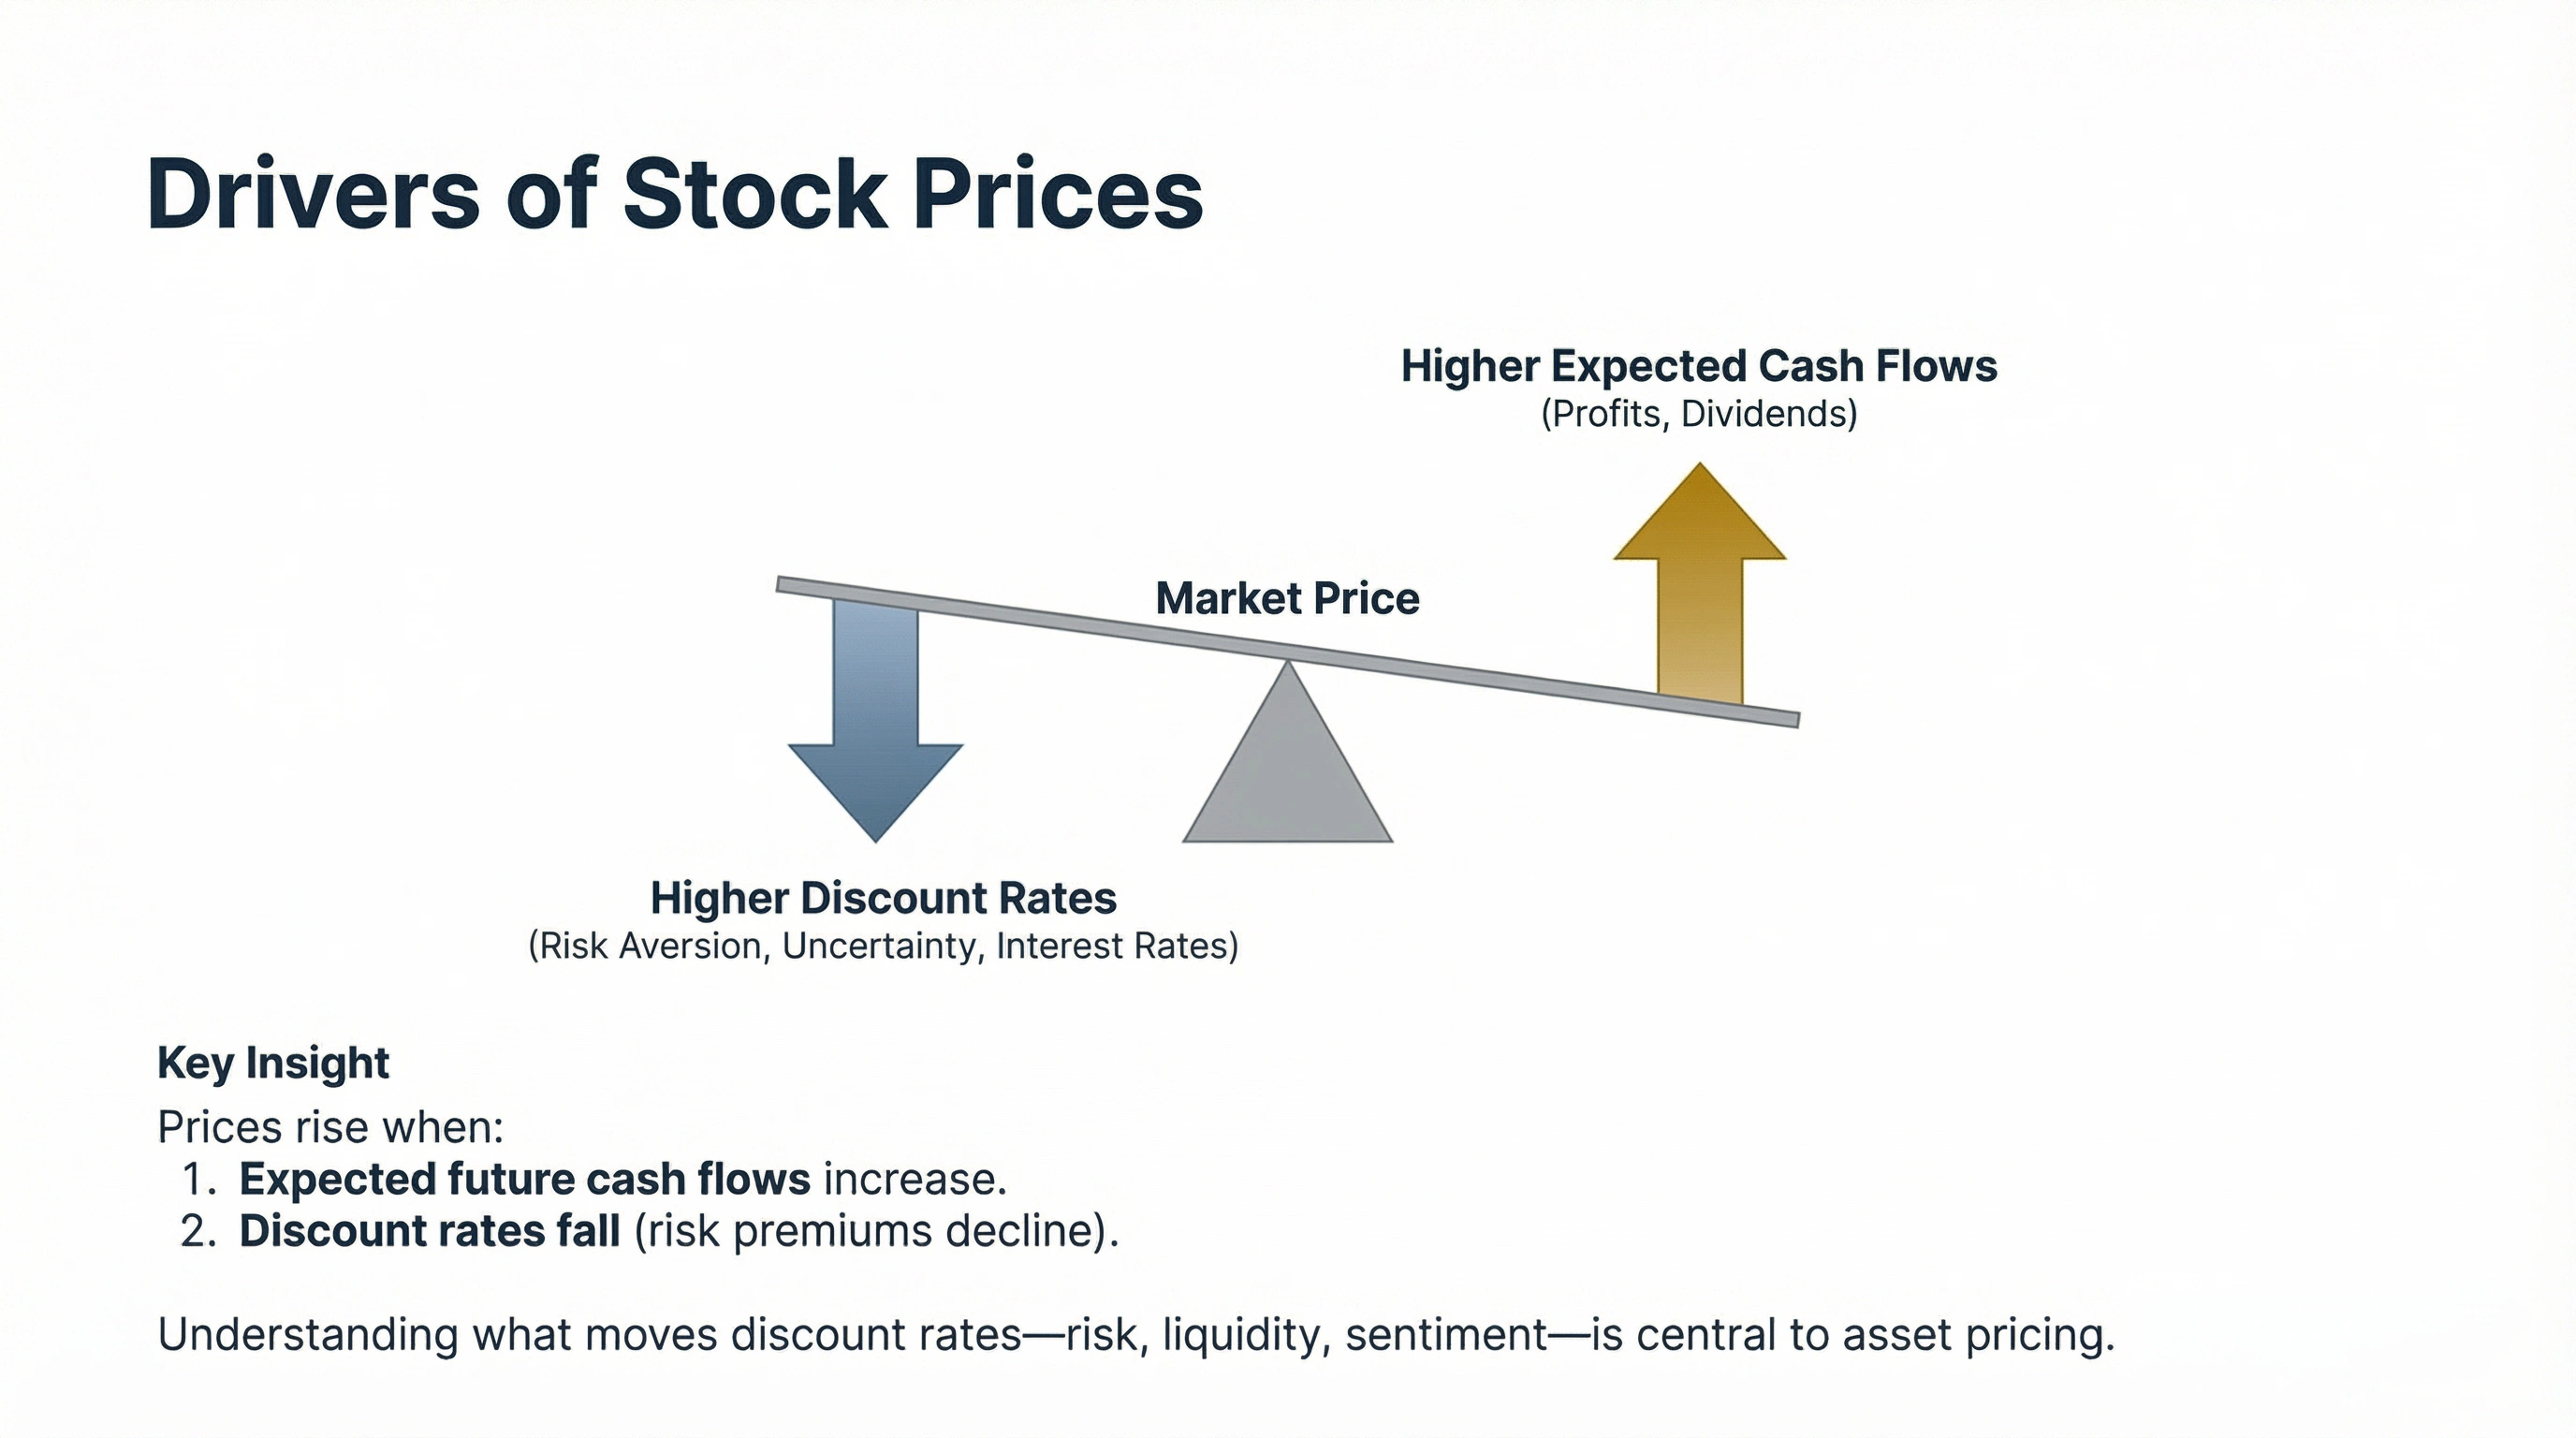
Drivers of Prices
Cash Flows vs. Discount Rates
Open Questions in Finance
Pricing, Structure, and Risk
Drivers of cash flows and discount rates remain elusive (Asset Pricing Puzzles).
A large part of the business capital is now privately-held, complicating measurement.
Concentration of stocks has significant implications for diversification and risk.
Part VII: Applications
Trade, Prices, and Cost Disease
Why Health Markets Fail?
Uncertainty and Asymmetric Information
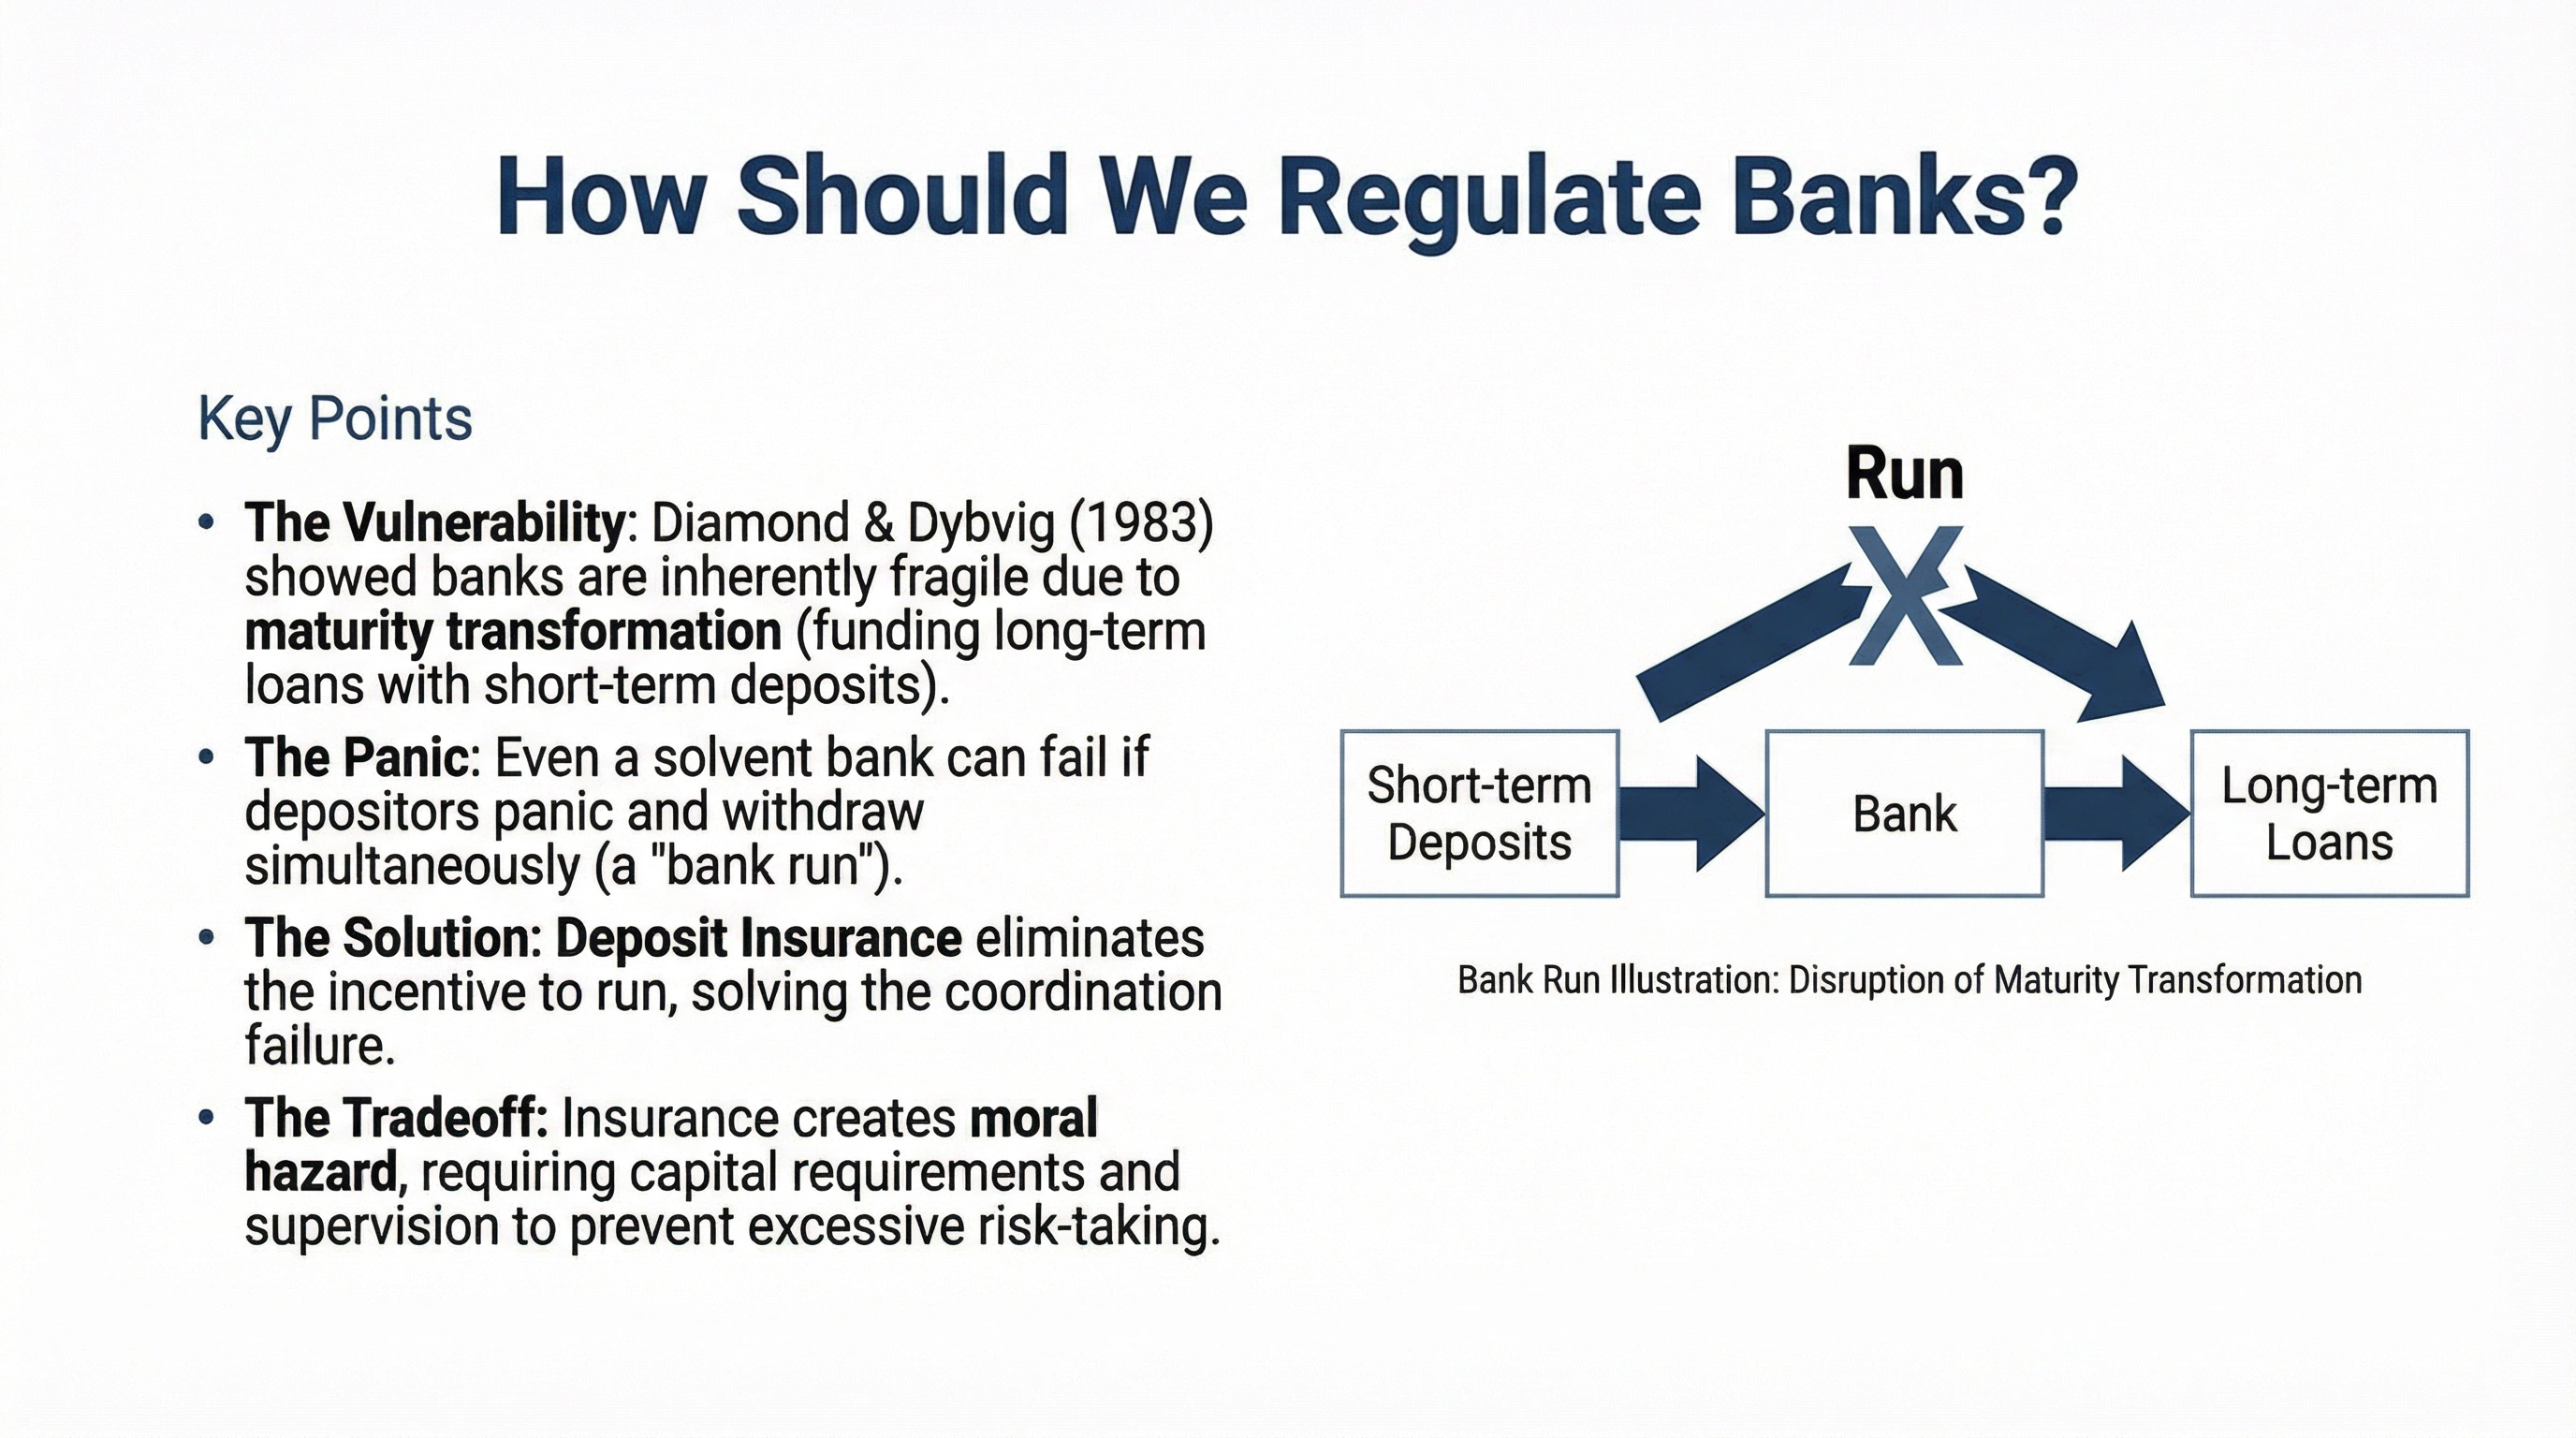
How Should We Regulate Banks?
Bank runs and deposit insurance
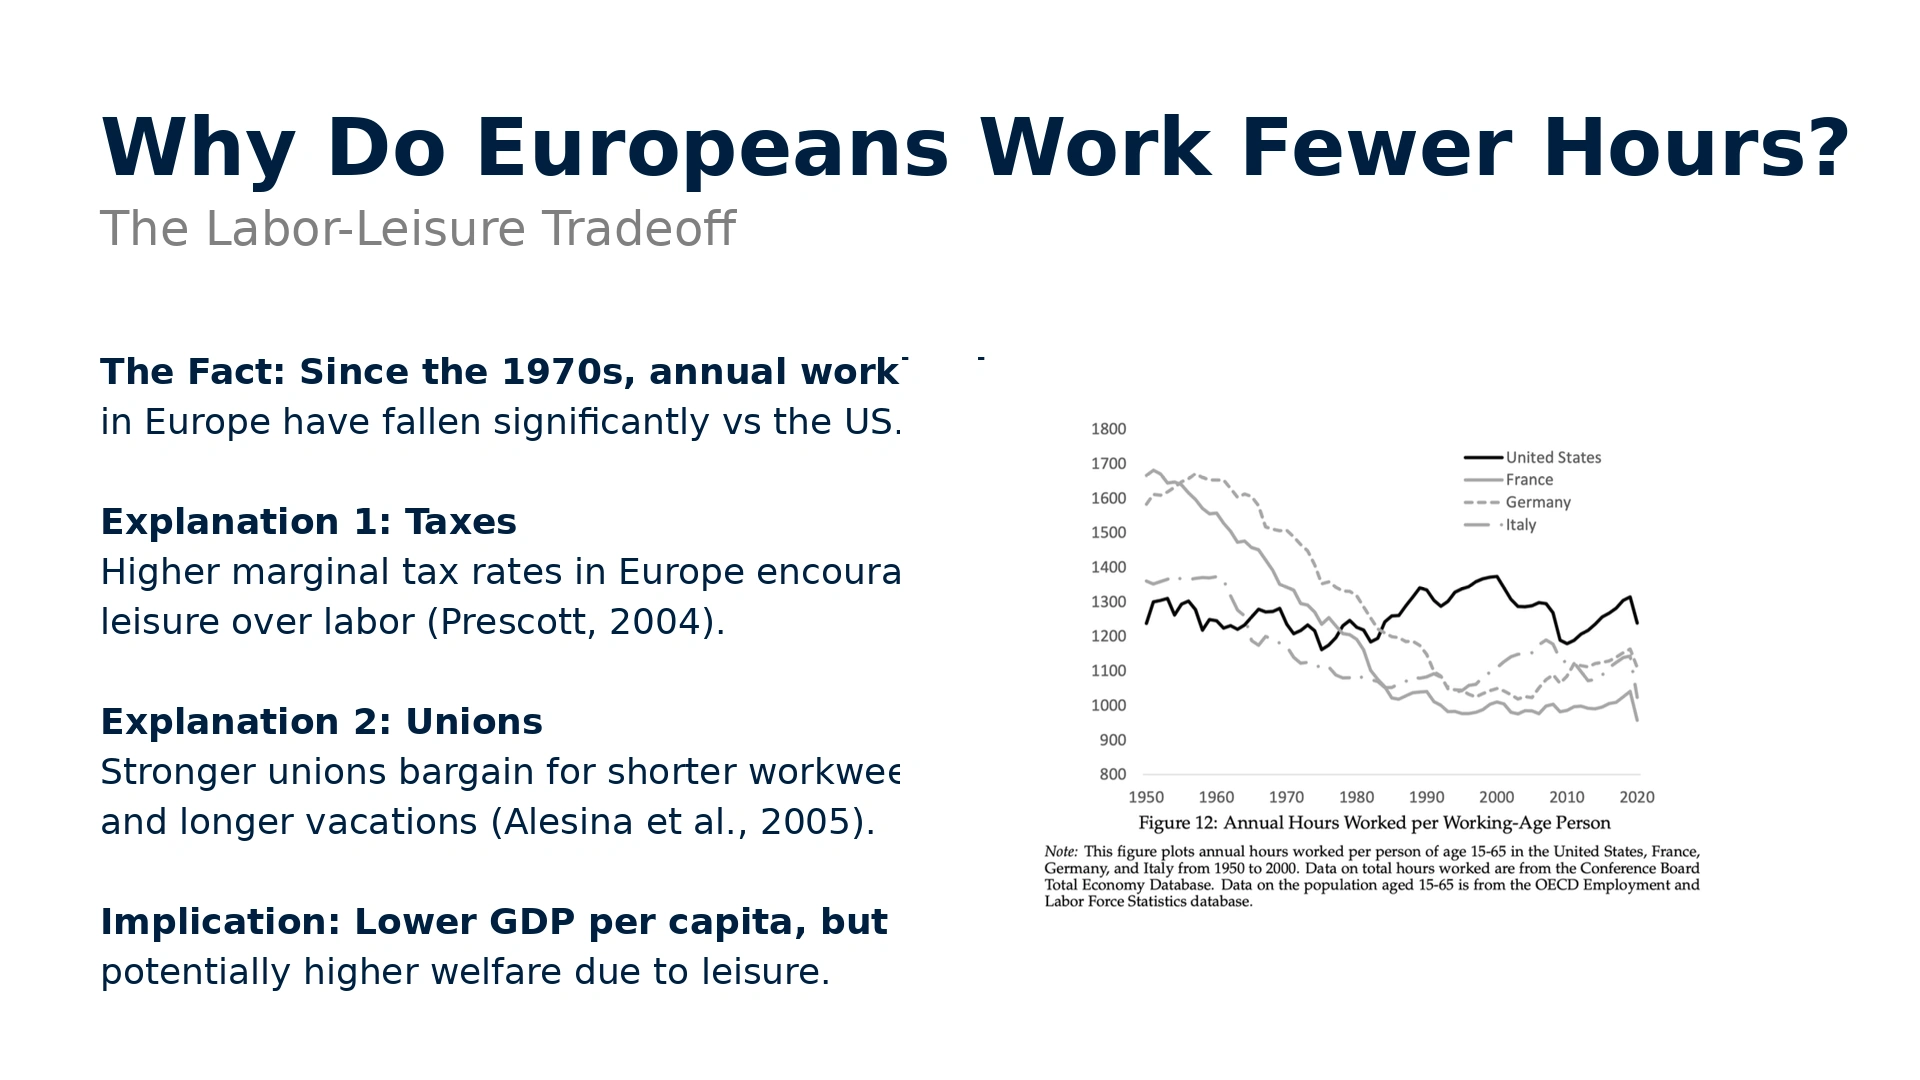
Why Do Europeans Work Fewer Hours?
The Labor-Leisure Tradeoff
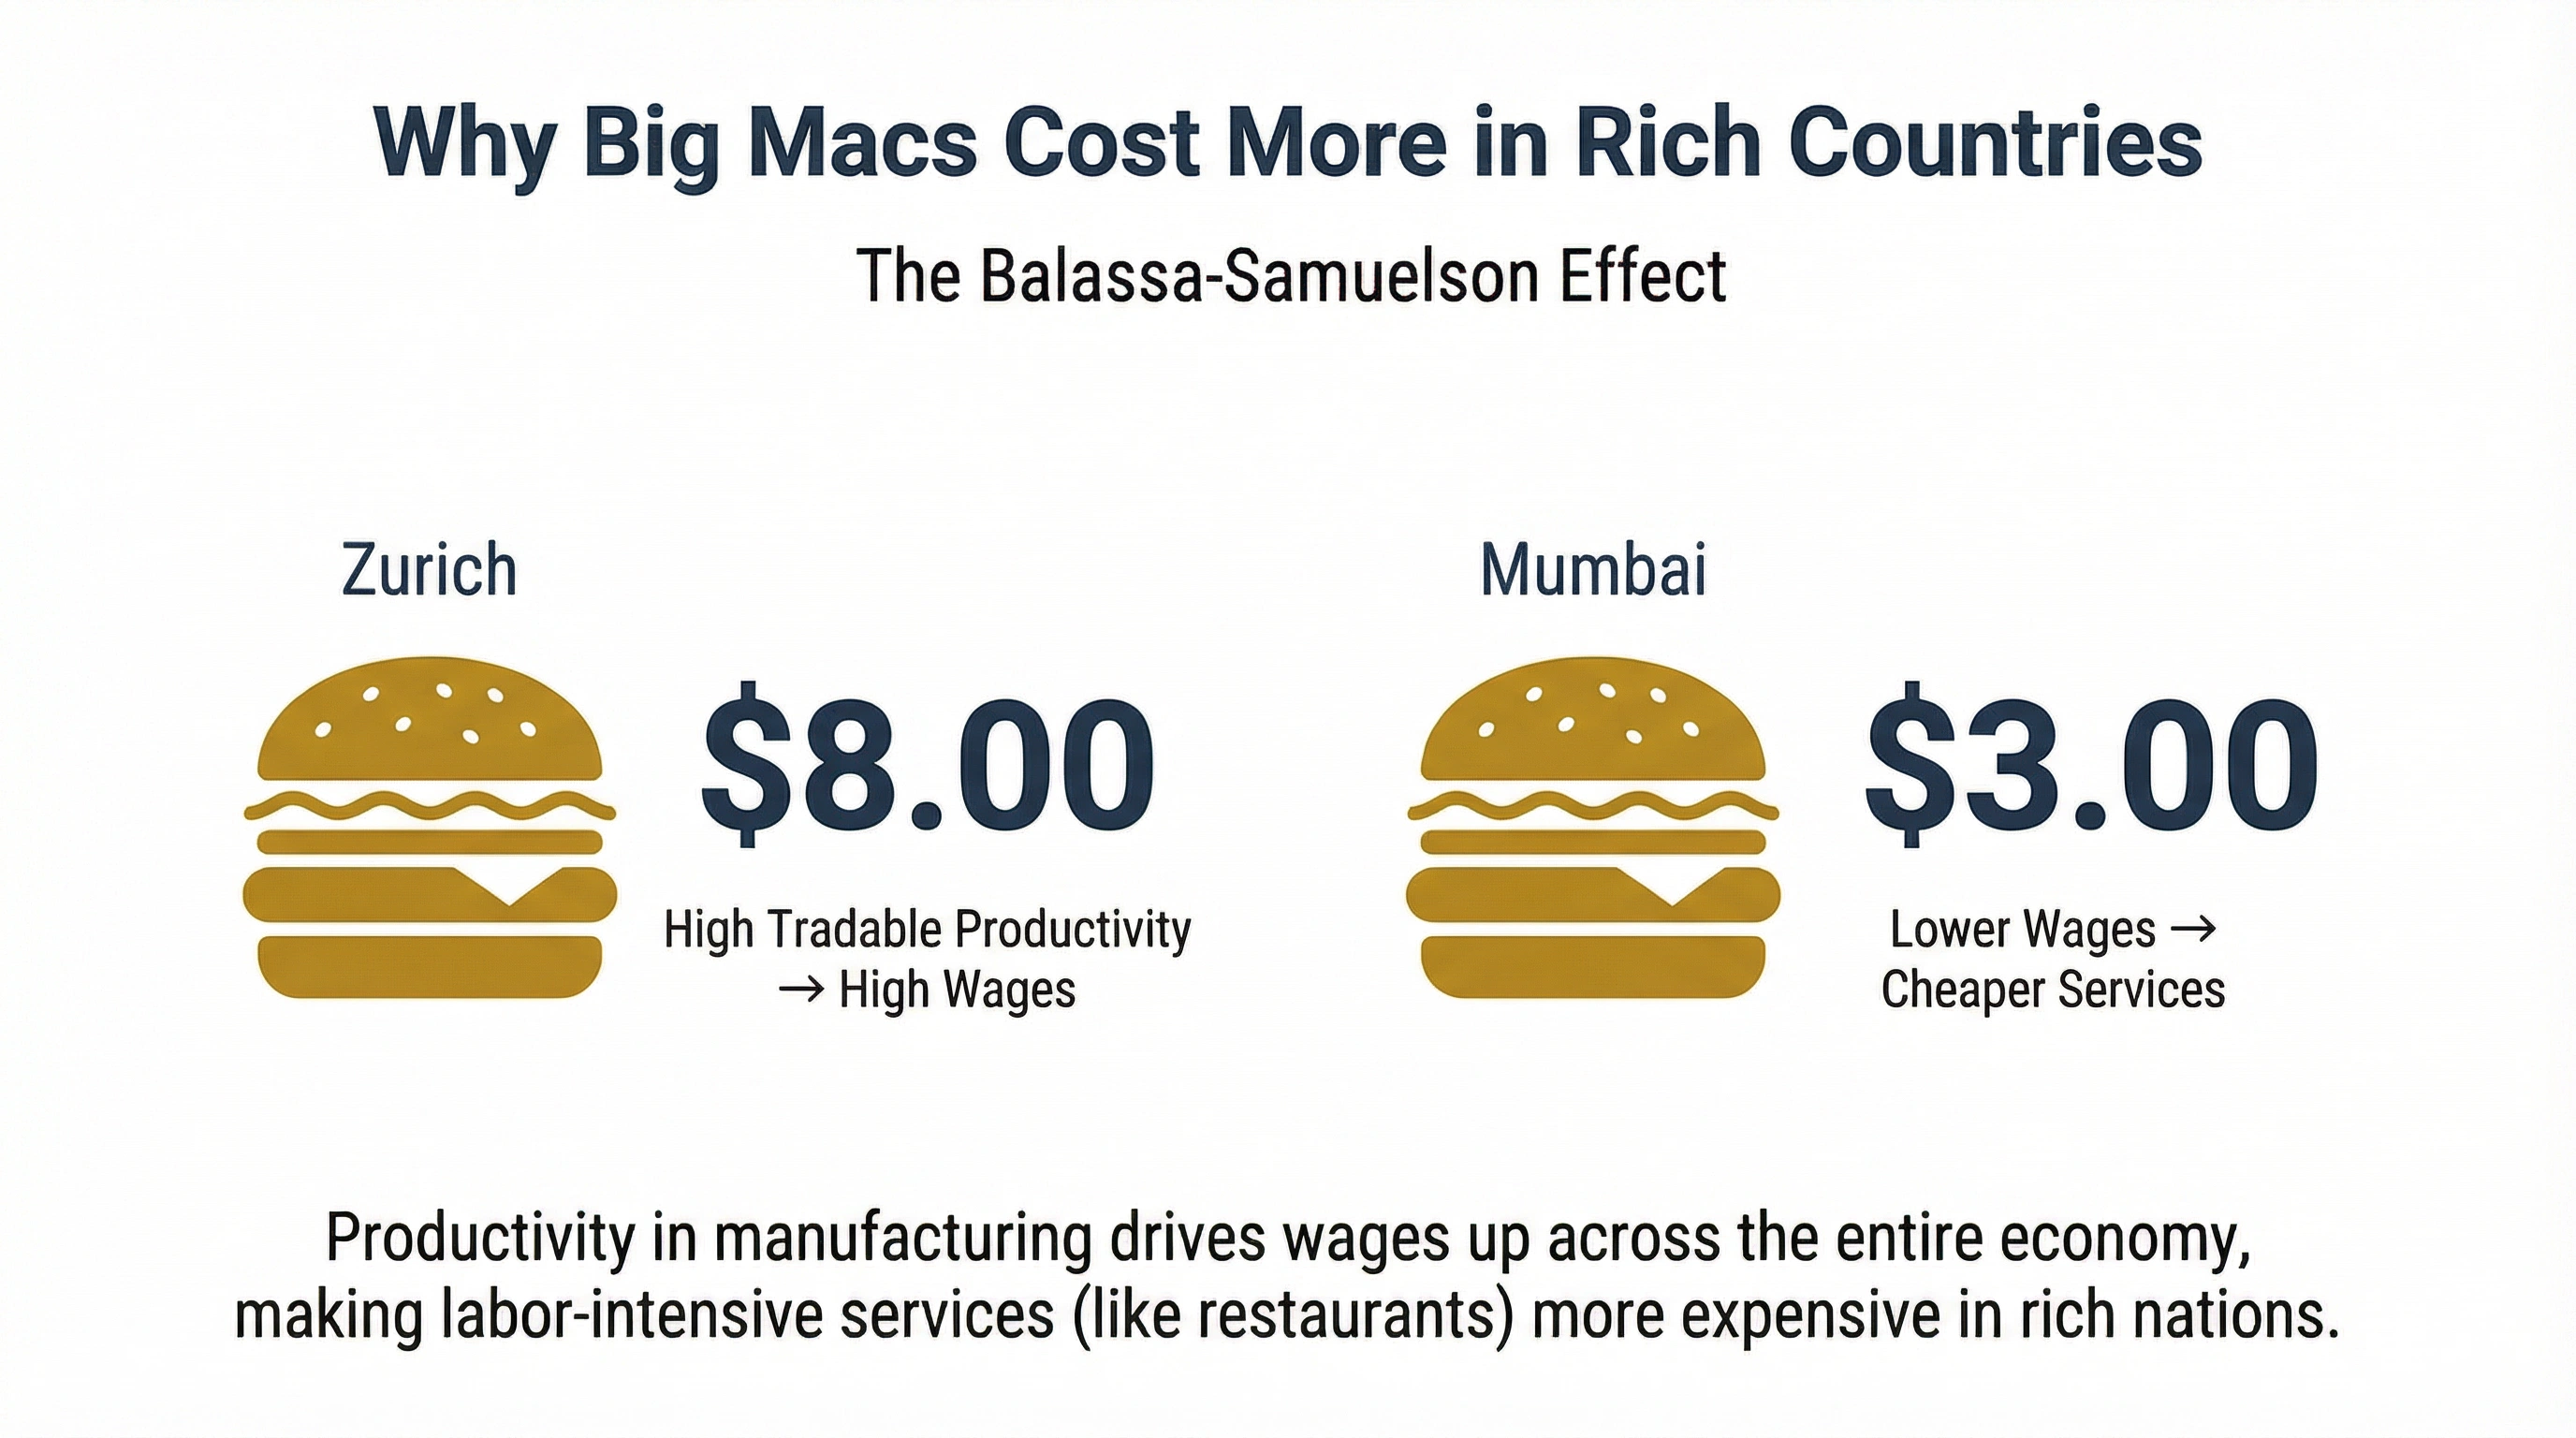
The Big Mac Index
The Balassa-Samuelson Effect
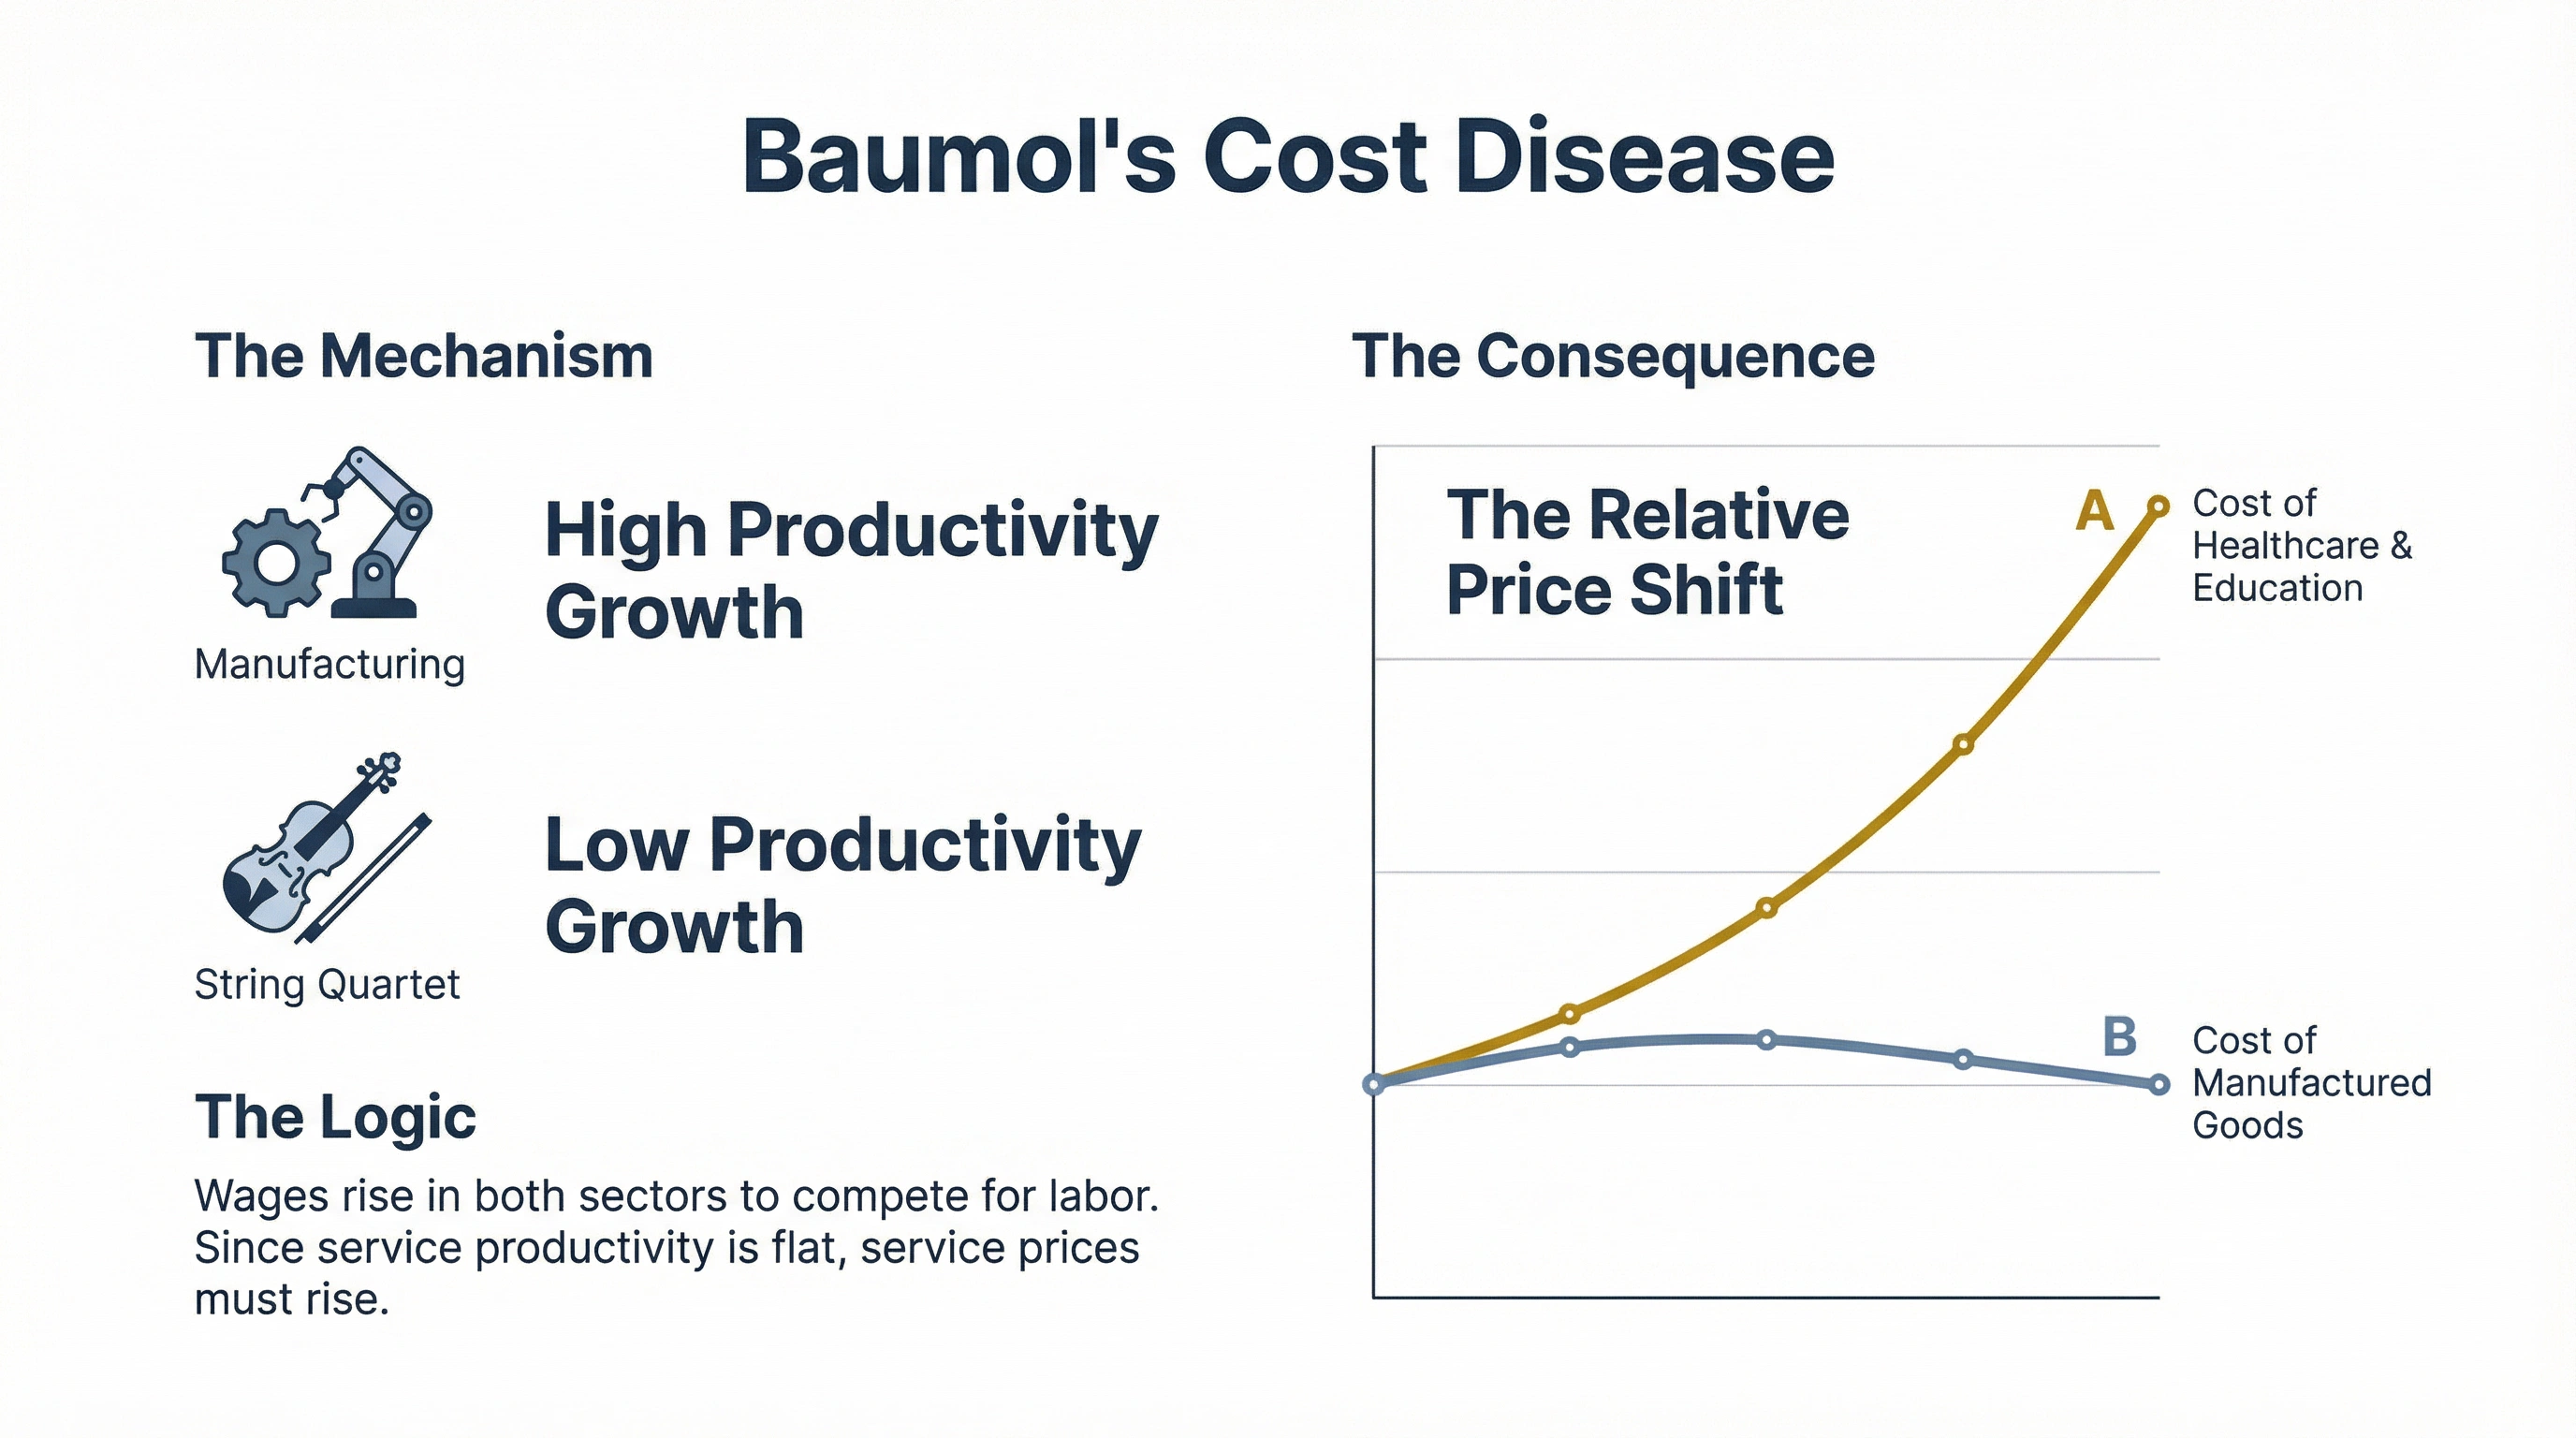
Why Do Health Care and Education Keep Getting More Expensive?
The Answer: Baumol's Cost Disease
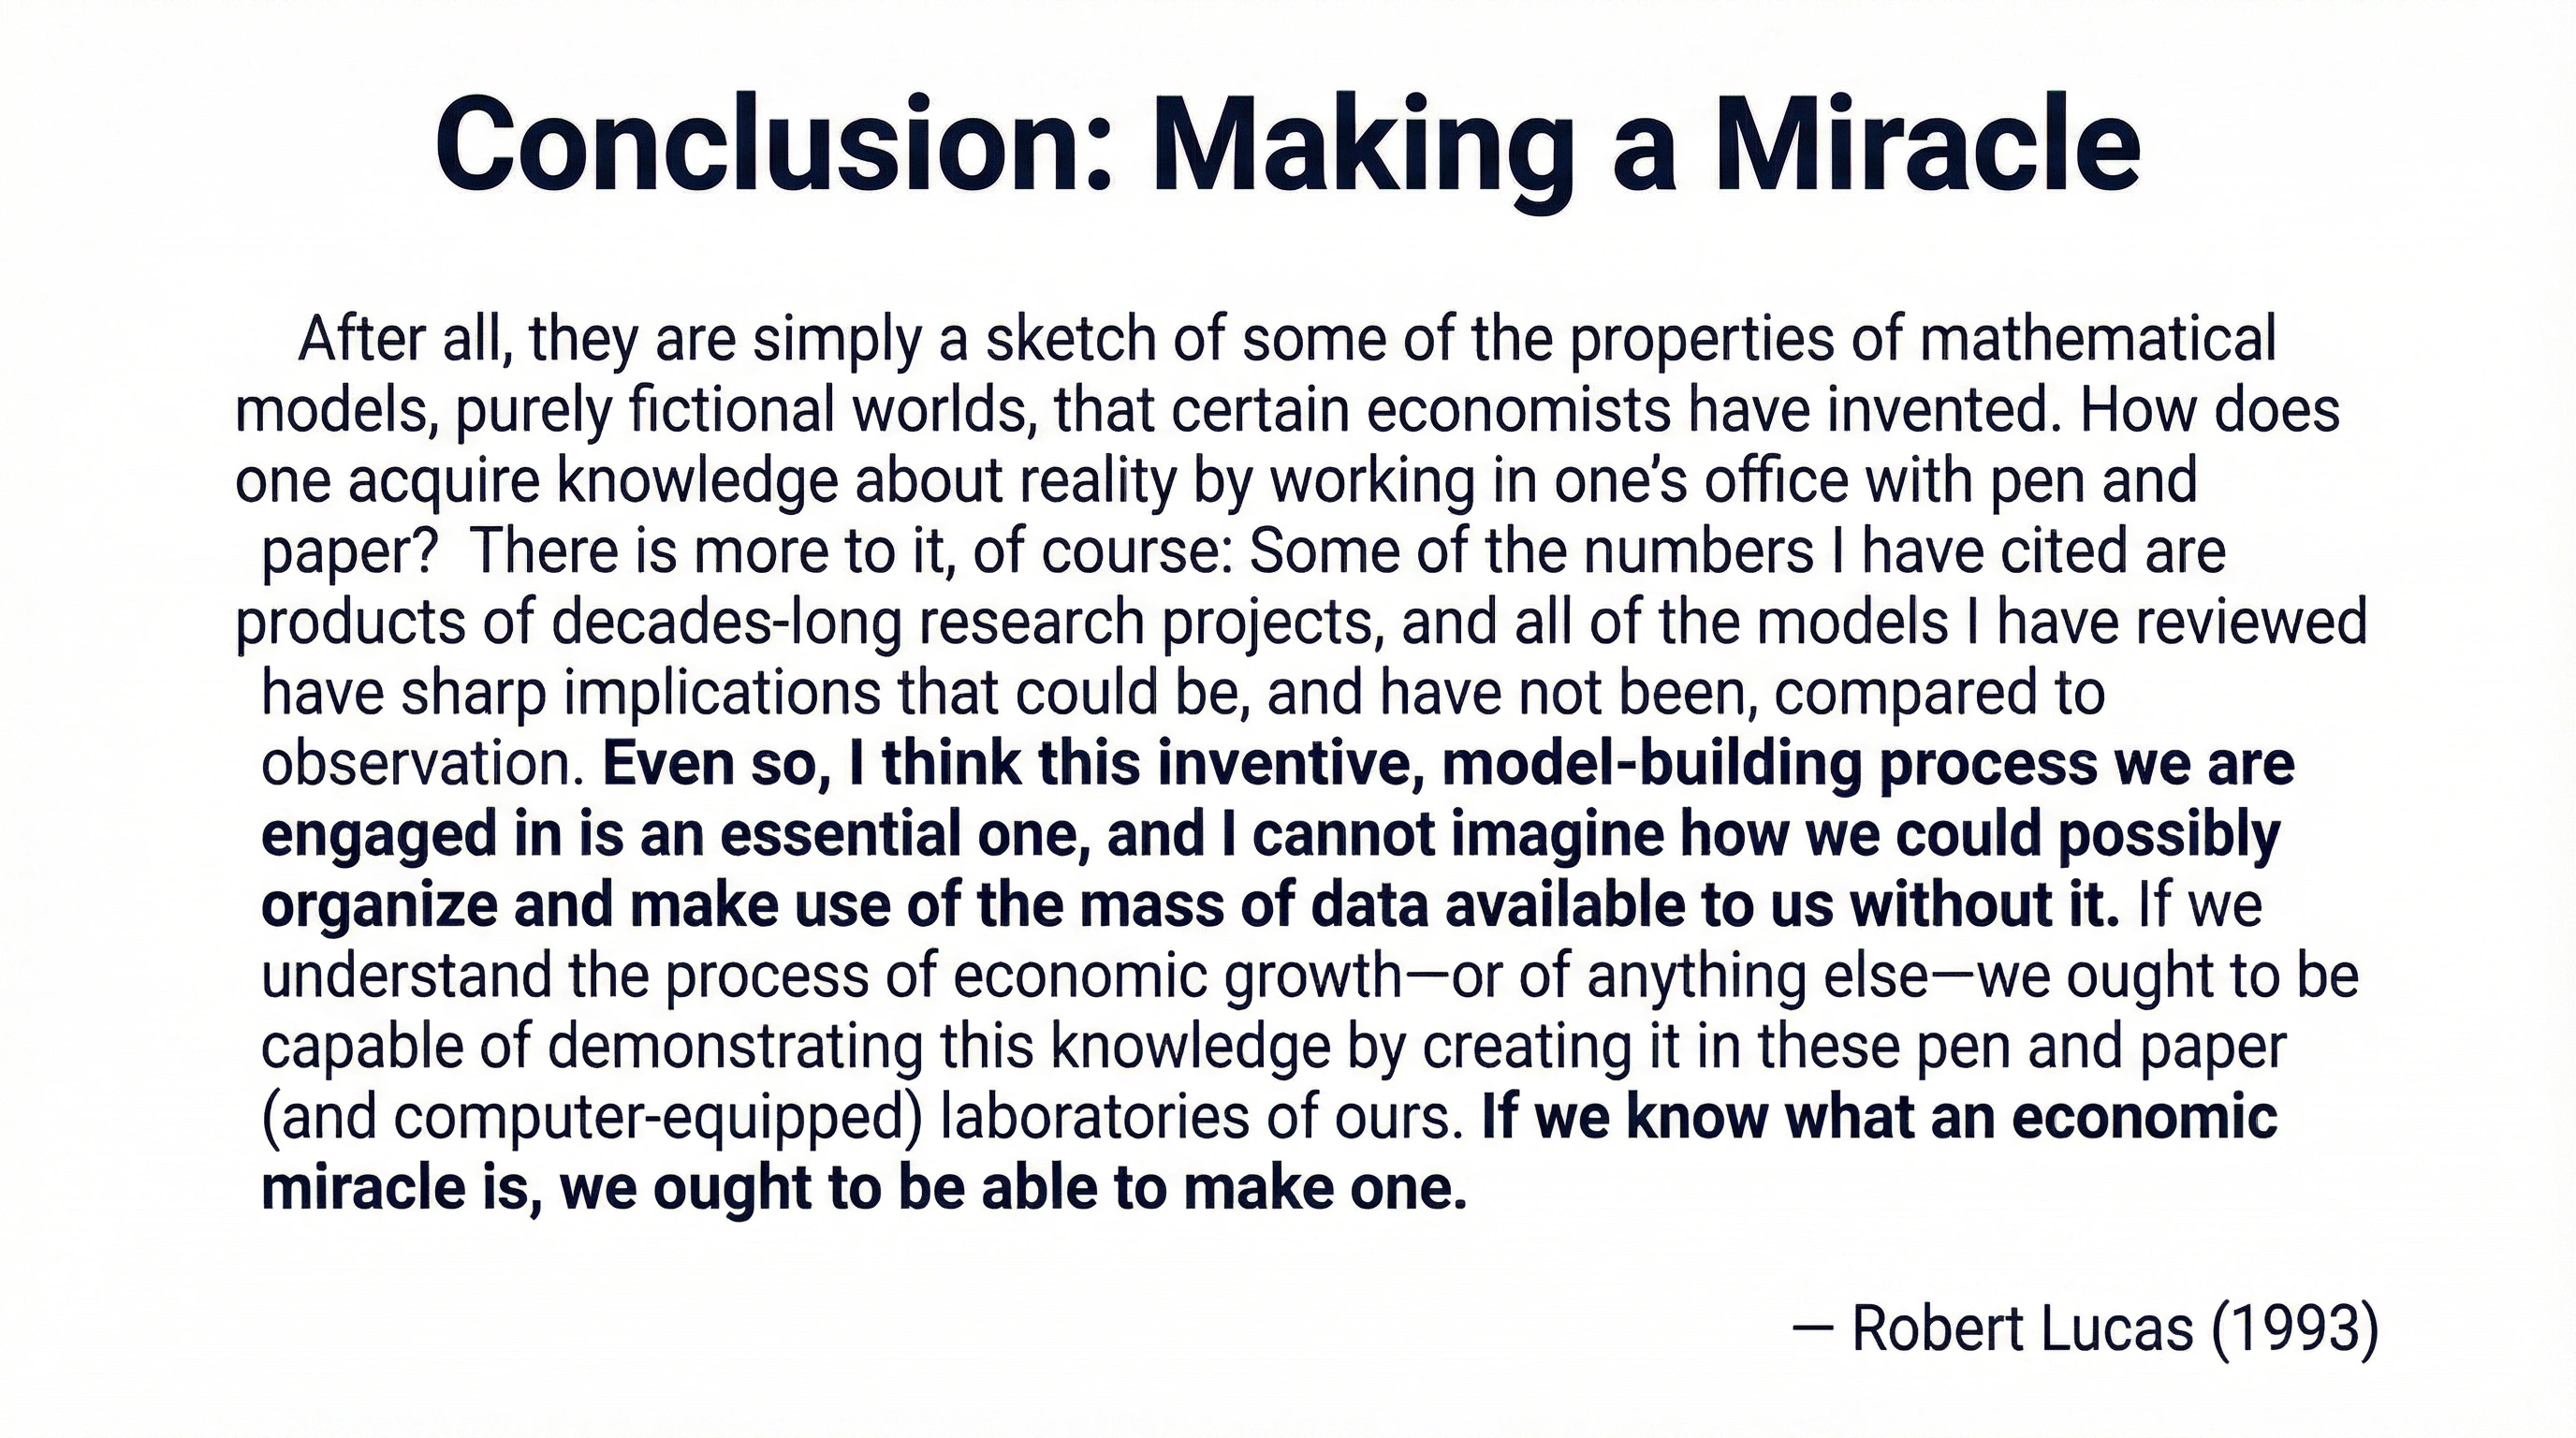
Conclusion: Making a Miracle
Robert Lucas (1993)